Trade the Tape – Three Cheers for 5,000!
Please find below the latest update from Adrian Tout from his regular newsletter, “Trade the Tape”.
Please note that this is for general information only and should not be considered personal financial advice.
The purpose of publishing these newsletters on the Ethical Offshore website is to provide investors some simple, easy to understand technical details on why the US markets are behaving the way they are at the moment, what has occurred to get them where they are, and what actions may influence where they end up in the near future.
The way Adrian Tout explains all this, in simple terms, I believe is good reading for any investor to get a better understanding of what is happening within the financial markets, what risks to be aware of and how to take advantage of these market conditions for your medium to longer term investment journey.

February 8, 2024 – Adrian Tout
Three cheers for 5,000….
-
How much further can this epic rally go..?
-
Monthly time frame offers useful perspective
-
Q4 earnings show only 2.9% YoY…. Good…. but not great
This week the S&P 500 closed above 5,000 for the first time.
Golf clap.
Another milestone as we climb the infamous wall of worry.
Over the past 100+ years the S&P 500 has averaged capital gains of ~8.5% per year plus dividends of ~2.0%
That’s a total return of close to 10.5% (on average)
If you compound 10.5% per year over 20 years – that’s a 637% increase.
But as we know, the pathway is rarely smooth.
For example, some years the market may “add 20%” and others it could give back a similar margin (or worse).
And we saw this happen recently.
However over the long run – markets will rise more often than they fall. Therefore, the percentage play is always from the long side.
One of the best charts offering perspective is this (which I shared last year):
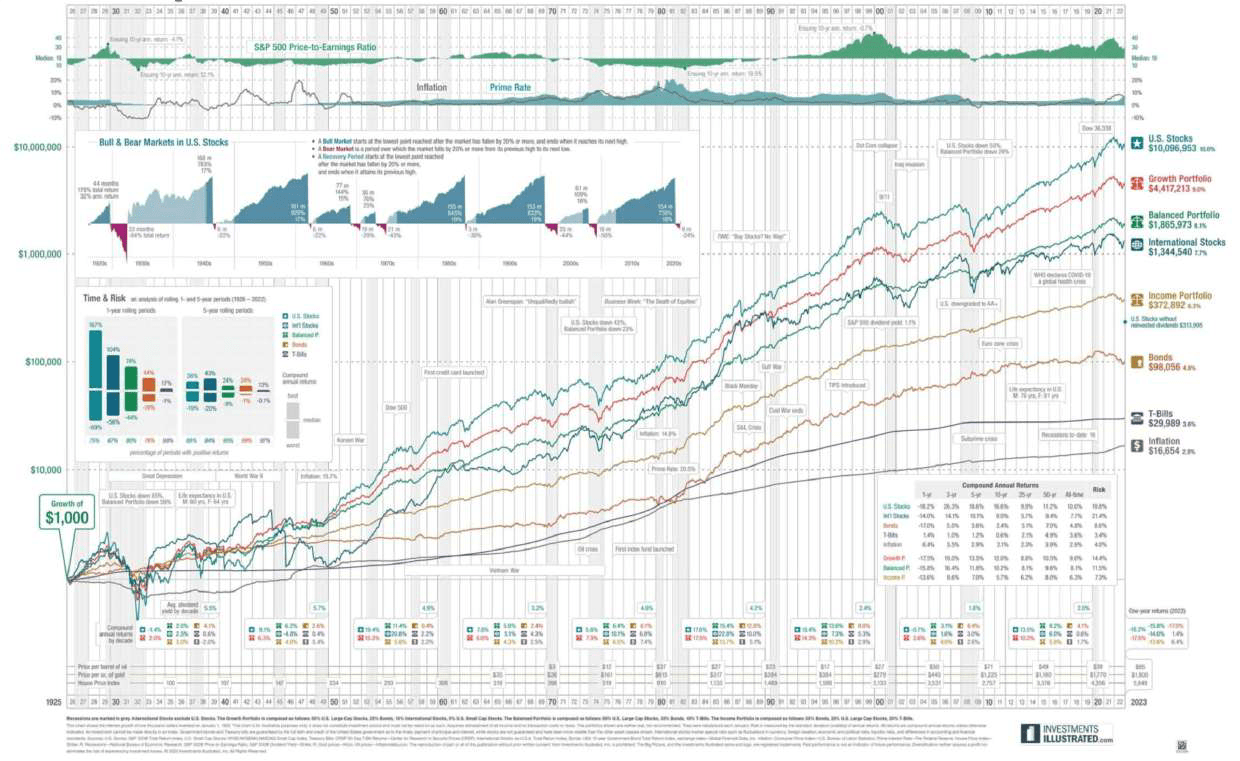
This shows how the market has continually navigated numerous headwinds.
From World Wars to depression to recessions to numerous financial crises.
That market finds a way through…
In more recent times (post 2000) – we’ve experienced two pullbacks of around 50%.
I’ve traded through both.
The first one hurt a great deal. The second one less so.
I’m willing to bet we will experience a similar 50% drawdown before 2030.
And guess what – it’s something to look forward to.
Experience has taught me these events are (rare) opportunities… not reasons to panic.
Great returns are created from buying low.
Something else to take away from this chart – U.S. stocks have typically outperformed all other asset classes over time (a conversation I love to have with people – especially those ‘married’ to real-estate or gold).
Whether the asset class is property, gold, bonds or overseas markets – U.S. stocks reign supreme.
And that’s certainly been the case the past few years – as gains in U.S. equities dwarf those of the UK, Europe, China, Australia and most other countries.
But let’s take a look at this current market rally.
S&P 500 Closes Above 5,000
The equity rally from late October 2023 has been nothing short of extraordinary.
I doubt if anyone forecast the S&P 500 trading above 5,000 by early Feb.
I certainly didn’t. Not even close.
From example, the average S&P 500 end of year forecast in the first week of January was just below 4800.
I shared this table of 18 bank / analyst forecasts:
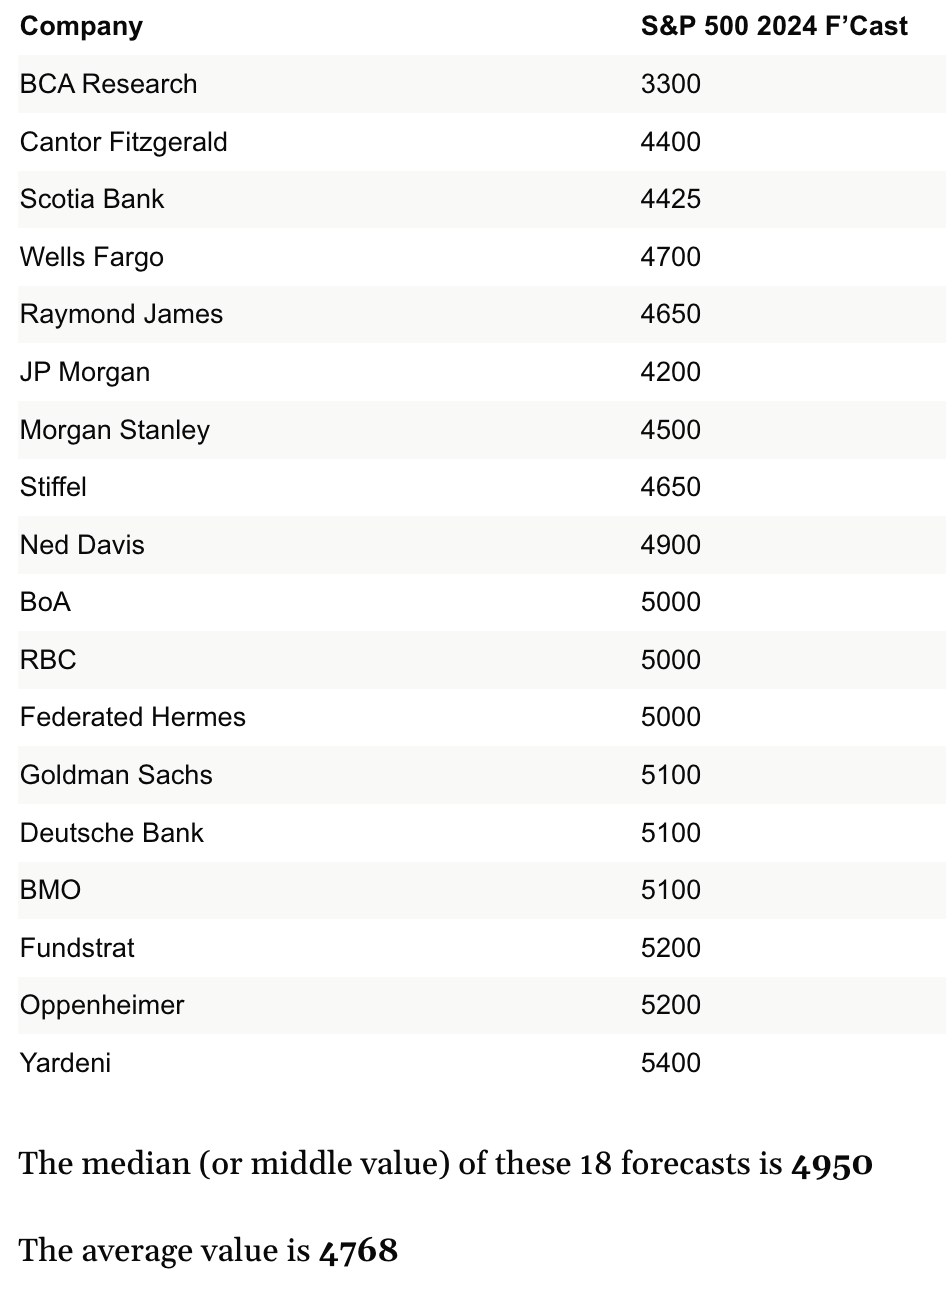
At this week’s close of 5026 – and ~6 weeks into the year – we’re already above most analyst’s EOY predictions.
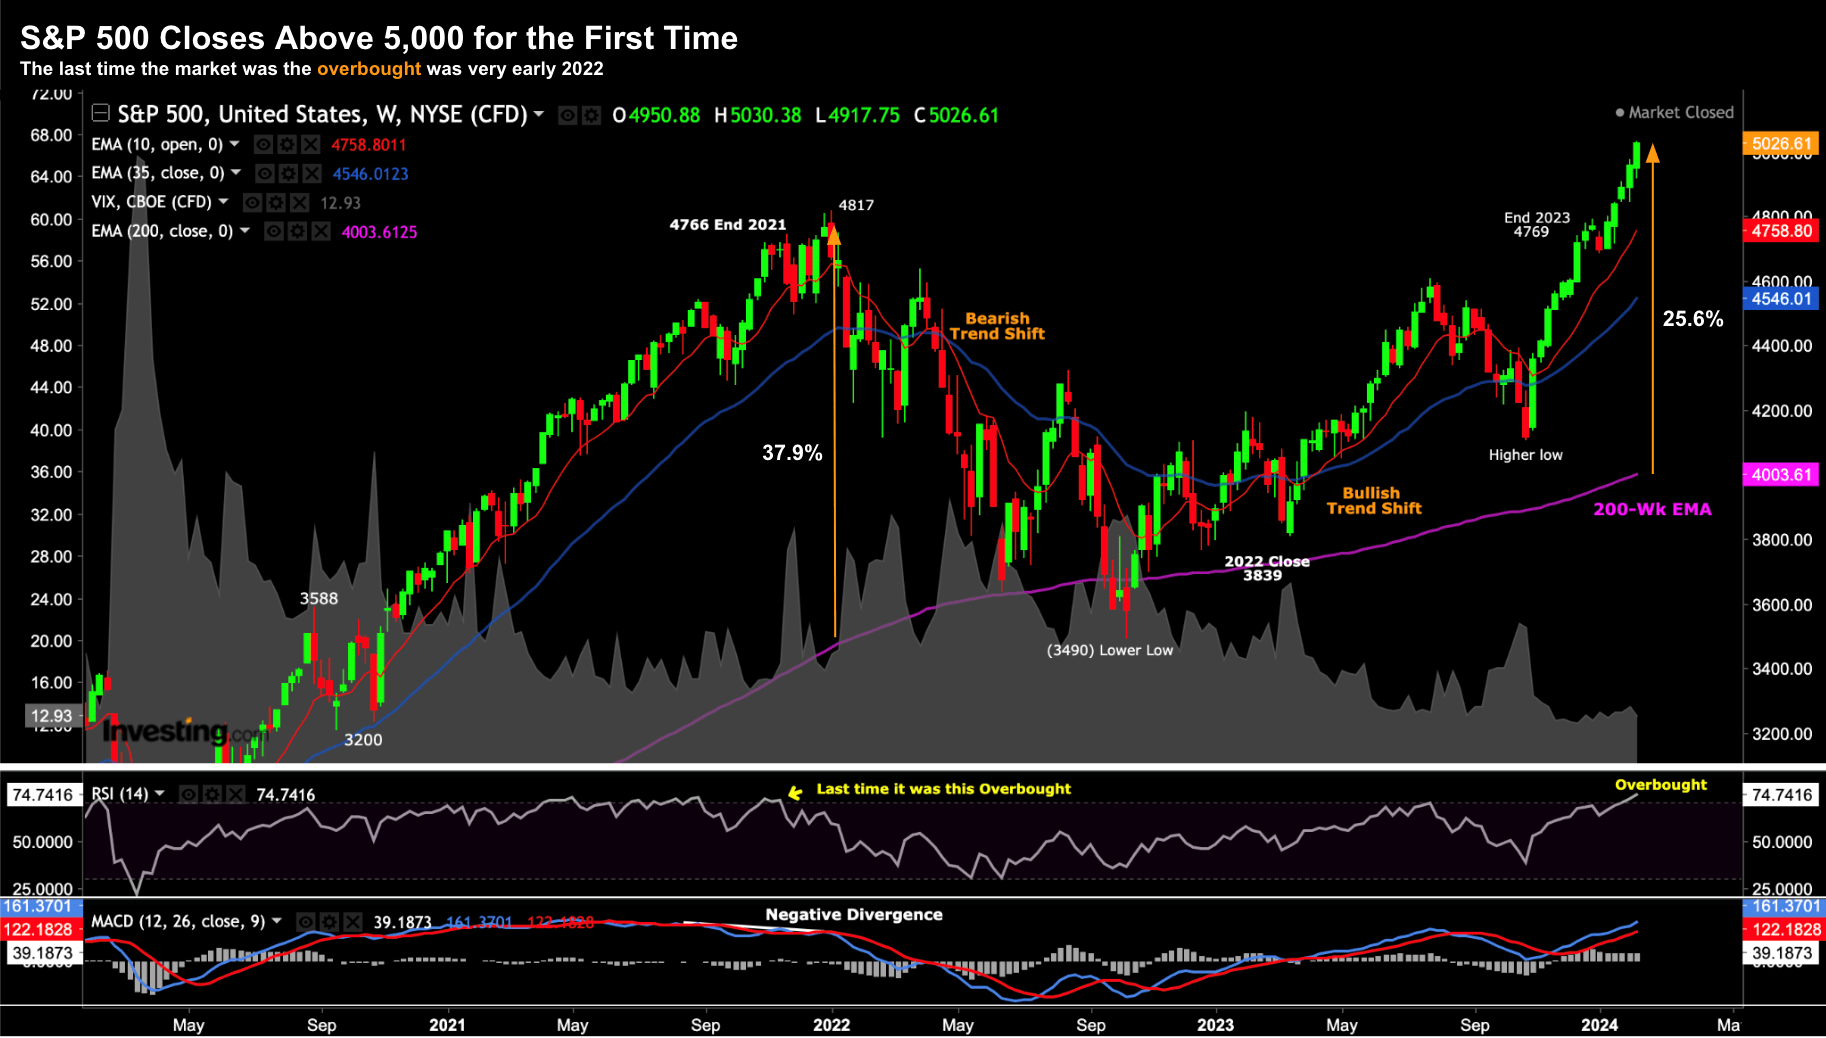
Let’s start with a look at the weekly chart (followed by the monthly):
 Feb 9 2024
A couple of observations:
First, there has only been one red candle (the first week of the year) since the week ending October 23.
That’s not typical. Generally stocks will pause for a breath over 6 months.
It’s little wonder we find the weekly Relative Strength Index (RSI) well in overbought territory.
The last time things were this (technically) extended was early 2022.
But as I remind traders – an overbought RSI is not a sell signal in isolation. The market can remain overbought for several weeks (if not months). For example, look at the period between May and September 2021.
However, typically sharp sell-offs occur from this zone.
Second, we’re around 25% higher than the 200-week exponential moving average.
And whilst this is less than what we saw in early 2022 – it’s also rare markets get this extended in this timeframe.
Bottom line – trade with caution – it’s difficult to say (with any conviction) there’s much left in this rally.
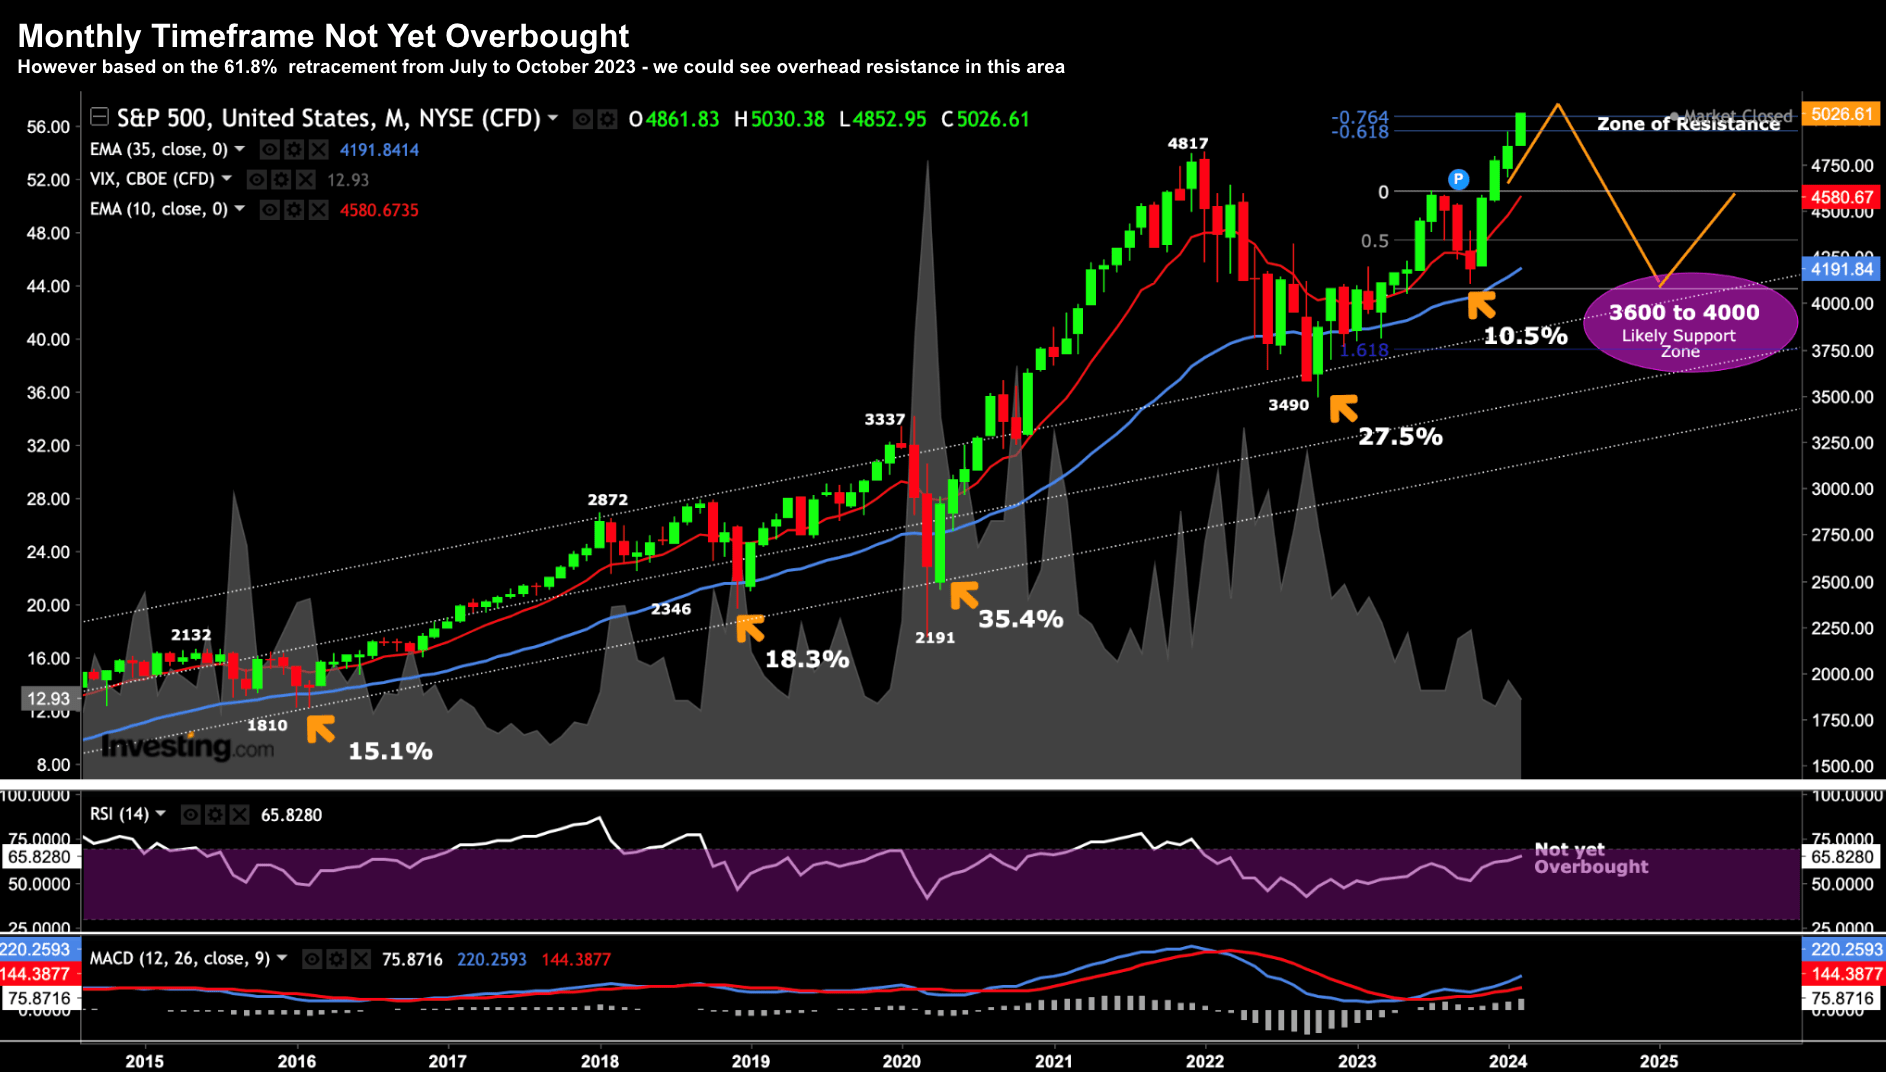
Let’s now shift our horizon using the monthly lens – as it paints a slightly different picture.
 Feb 9 2024
Using this horizon – we are not yet overbought (as we were in both 2018 and late 2021)
However, things are looking extended in terms of distance from the 35-month EMA (which is similar to the 200-week EMA)
Two other observations:
- 61.8% to 76.4% outside the retracement from October last year is around 5,050 – where we are trading now. This zone could act as an area of resistance; and
- We have seen 5 pull backs of at least 10.5% since 2016. In each case we traded down to the 35-month EMA (or slightly below) where it found support. That level is currently 4191
From mine, this is the zone where you would look to start adding exposure (more on this in a moment when I assess the forward PE based on Q4 earnings).
For example, pending what we see with the U.S. election, the tensions in the Middle East, Chinese slowdown, oil prices, monetary policy, bond yields and Q1 earnings – it would not surprise me to see us test this area.
Speaking of earnings…
Q4 Earnings Good… Not Great
Factset furnished us with the latest update on Q4 earnings this week.
In short, earnings have improved this week. However, the growth in earnings does not equate to the surge we have seen in equities.
The blended earnings growth rate for the 67% of S&P 500 companies who have reported fourth quarter is 2.9% YoY.
The good news is that’s up from 1.6% last week and an earnings growth rate of 1.5% at the end of the fourth quarter (December 31).
Looking ahead, analysts expect YoY earnings growth of 4.0% for Q1 2024 and 9.1% for Q2 2024.
That’s a rapid ascent higher which will require a robust (spending) consumer.
For the full year 2024, analysts are calling for YoY earnings growth of 10.9% (slightly down from the 12% a few weeks ago)
Factset also tell us the forward 12-month P/E ratio is 20.3, which is above the 5-year average (18.9x) and above the 10-year average (17.7x).
Echoing Leon Cooperman the other day – that’s too rich for my blood.
It’s worth noting that a 17.7x forward PE puts us around 4159 (i.e. the 35-month EMA zone shared earlier) – which implies a (potential) correction of ~18%
Putting it All Together
One thing I’ve learned over the past 25+ years in this game is markets will often go further than what you thought was possible (in both directions)
When you think they can’t go higher – they do. And when you think the selling is finished – it’s generally not.
For example, if you asked me whether the S&P 500 would be trading above 5,000 in early February late last year – I would have said it’s less than a 20% probability (a bet I would not take).
But here we are…
Fortunately I have long exposure (which I’ve since pared) – and did not put on any short positions.
So far that bet has been prudent.
Traders taking short positions on the basis the market is overbought have been crushed (in turn forcing them to cover – helping to drive up prices).
What’s more, it’s possible that zero-dated options (a relatively new phenomenon) is playing a role. Steve Sosnick – Chief Strategist at Interactive Brokers – wrote about this recently:
Last year, we saw exchanges list so-called “zero-dated” or “0DTE” options listed in a range of key indices and ETFs. They have proven immensely popular, with cumulative options volume setting a record last Thursday (the day after the FOMC meeting).
For better or worse, they have made speculation incredibly easy. It is likely that these products exacerbated December’s decline, and it is almost certain that they have accelerated this year’s rally.
Most traders are more comfortable trading from the long side rather than the short side, which explains the recent pops in volume on up days.… it would not be surprising if these ultra-short-term options lead to microbursts of volatility and the occasional spurious move
Who knows for certain – but I’m sure they are playing some part in this euphoria.
Trade safe. Stay patient. This is a long game.
Regards
Adrian Tout
The above article is for information only. The views of the author or any people quoted are their own and do not constitute financial advice. The content is not intended to be a personal recommendation to buy, sell or hold any specific investment or to adopt a particular investment strategy. However, the knowledge that professional analysts provide can be a valuable additional filter for anyone looking to make their own investment decisions.
Ethical Offshore Investments provides guidance on portfolios that have an ESG (Environmental & Social Governance) bias and an SRI (Socially Responsible Investing) focus. By avoiding high charging, commission paying funds, this results in lower portfolio costs, so more of the growth staying in the pockets of our clients.
Ethical Offshore Investments can also assist clients in getting exposure to the investment markets such as the broad S&P 500 index through very low cost Exchange Traded Funds (ETF’s) as well as investing directly into the individual stocks.
If you would like to get more information on the Sustainable Ethical Allocation portfolios, or enquire on the vast array of Sustainable and Ethical style funds available, please click on More Information.