Trade the Tape – Half Way Through Earnings: 81% Beat on EPS
Please find below the latest update from Adrian Tout from his regular newsletter, “Trade the Tape”.
Please note that this is for general information only and should not be considered personal financial advice.
The purpose of publishing these newsletters on the Ethical Offshore website is to provide investors some simple, easy to understand technical details on why the US markets are behaving the way they are at the moment, what has occurred to get them where they are, and what actions may influence where they end up in the near future.
The way Adrian Tout explains all this, in simple terms, I believe is good reading for any investor to get a better understanding of what is happening within the financial markets, what risks to be aware of and how to take advantage of these market conditions for your medium to longer term investment journey.

July 28, 2023 – Adrian Tout
Half Way Through Earnings: 81% Beat on EPS
-
Earnings & Revenue are beating expectations
-
Why lower inflation could be headwind to earnings growth
-
Is paying 21x forward earnings a good risk / reward bet..?
This week was the busiest week of earnings on the calendar.
Half of all S&P 500 companies have now reported for Q2.
And so far… so good!
81% of companies have beaten earnings per share (EPS) expectations – by an average of about 6.4%
By way of comparison – prior to COVID – the average EPS beat was in the realm of ~3%
What’s more, about 64% of all companies have also beaten top line expectations.
Here is a list of what sectors are performing best (relative to expectations)
-
Consumer Discretionary – up 36.3%
-
Communication Services – up 16.1% (dominated by Google and Meta)
-
Industrials – up 11.5%
-
Technology – up 0.3%
What’s interesting (to me) is tech is basically flat.
However, with prices rallying, what we have seen is simply multiple expansion. I will talk more to why this is a risk shortly…
And in terms of the worst sector performers:
-
Energy – down 48.5% (which is now a good sector to start looking)
-
Materials – down 29.3%; and
-
Health Care – down 29%
In summary, the market is celebrating the stronger-than-expected numbers.
And this has some asking – is the bottom in for earnings (after what will be three consecutive quarters of contraction)?
Is the Earnings Trough In?
Given the above, it’s little wonder stocks continue to rally.
But another reason we’re seeing new highs are improved expectations looking forward.
That is, they think the bottom is in.
And whilst that assumption could be true – it also assumes there is not a recession next year.
Earnings will always contract during a recession. No exceptions.
For example, below is what the market is pricing in with respect to EPS growth YoY:
-
Q2 2023 – Down 6.4% (vs initial expectations of around 7%)
-
Q3 2023 – Up 1.1%
-
Q4 2023 – Up 9.3%
-
Q1 2024 – Up 8.4%
-
Q2 2024 – Up 14.5%
From Q4 onwards, the market has set high expectations.
And that’s the essence of the bullish thesis; i.e.,
-
Very strong earnings; and
-
Strong economic momentum
Now the S&P 500 commands a forward multiple of close to 21x – on the basis we will grow into these valuations.
So what could go wrong?
Reasons to Challenge the Bullish Thesis
Look, there’s a lot to like with what we have seen with earnings so far.
There is very little ‘blood on the streets’… basically none.
What’s more, we’ve seen exceptionally strong fund flows – with over $70B going into mutual funds.
That’s a good sign of bullish momentum.
But does that translate into everything will “come up roses” the next 12 months?
That’s hard to say but let’s try and think of a few questions we should ask.
Let’s start with what the market is asking you to pay.
Remember:
It’s not just about what you buy – it’s equally how much you pay.
For example, no-one debates that “Apple or Microsoft” are great stocks. But that doesn’t mean you can’t get badly hurt paying 31x forward earnings.
To start, with EPS for 2023 forecast around $220 per share – with the S&P 500 at 4582 – that’s 20.8x forward.
If we take the inverse of this PE ratio (1 / 20.8) – we get an earnings yield of 4.8%
That’s far less than the risk-free money market yield of around 5.25%
As a benchmark – the last time we saw this happen was in 1999.
Not surprisingly, it was also when tech stocks traded at 31x forward.
We all know what happened next…
But think of it this way…
With a risk-free rate of ~5.25% (or thereabouts) – the S&P 500 would need to rally to 4834 to match what you can get risk-free today.
From mine, that’s a tall order, where the forward PE would be closer to 22x.
Therefore, you need to ask yourself two things:
- Is the risk to the upside? or is it
- More towards the downside?
If you ask me, it’s the latter.
However, if you believe that earnings are about to explode higher (and economic conditions are going to become more favorable) – then maybe you think the risks are to the upside.
But that’s not me…
What are the Potential Triggers?
From mine, the most important thing to consider is what we are being asked to pay for earnings.
Again, if everything goes to plan, earnings will see:
- Q3 2023 – Up 1.1%
- Q4 2023 – Up 9.3%
But is that unrealistic?
Let’s consider the following…
One of the primary beneficiaries of inflation are earnings.
That is why it’s always good to buy stocks in a high inflationary environment.
Consider Walmart as a basic example.
Last quarter they reported sales growth of 6% YoY.
But guess what inflation averaged over that time? You got it – it was ~6%.
Put another way – in real terms their sales were flat.
Company revenue is always reported in nominal terms. Therefore, they benefit from inflation.
Now consider the alternative…
When inflation is cooling (as it is) – then earnings do not stand to enjoy the same “free” ride.
That will be headwind in terms of year-on-year comps… making those double-digit growth assumptions very aggressive.
The other factor is what is happening in the broader economy.
I talked to some of the questions we should be asking here… below is a recap:
-
Consumer excess savings falling from $2.3T (2022) to less than $1.0T;
-
Credit card debt exceeding $1.0T – carrying an average interest rate of 24% (where banks have doubled their loss provisions);
-
Retail sales are slowing;
-
Fiscal spending is starting to be curtailed (after record deficits the past two plus years);
-
The Fed likely to continue to hold rates where they are – meaning real rates are rising (as inflation falls);
-
Central bank also continue to reduce their balance sheet (a form of monetary tightening); and finally
-
The 18-24 month lag effect of the 525 basis points of rate increase (which is only just starting to bite)
All of these are potential triggers for a generally slowing economy.
With that let’s take a look at how the market finished the week.
S&P 500: Euphoric
The price action so far this year has been nothing short of euphoric.
Rarely do we see the S&P 500 up ~20% in the space of just 7 months.
But here we are…
And whilst the market has the potential to keep going (as it has a lot of momentum) – one needs to be mindful of the downside risks.
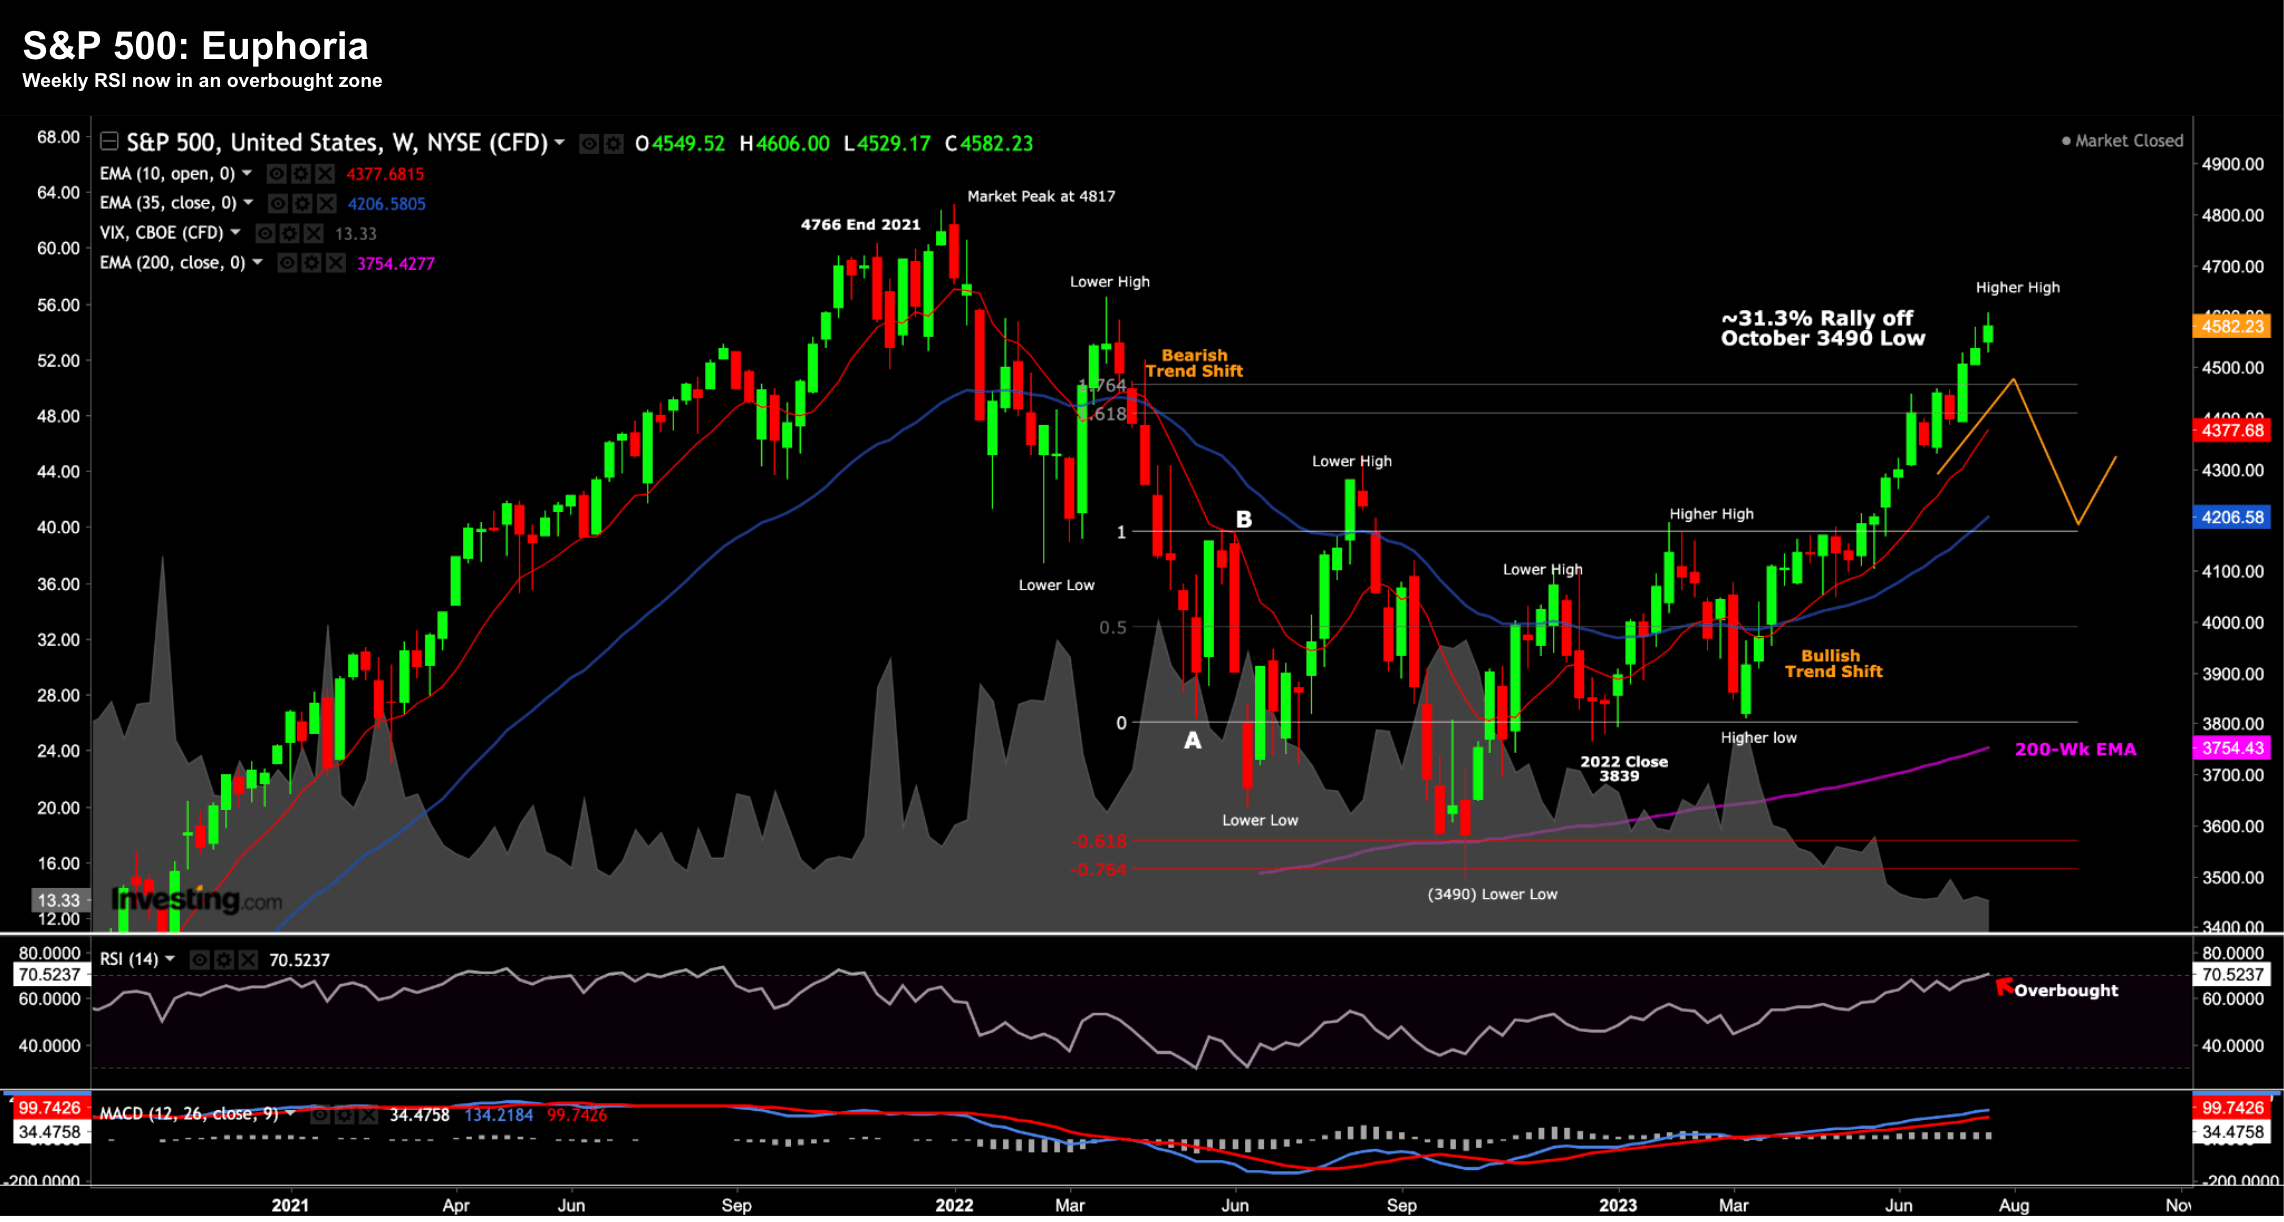
The one technical thing to call out is what we see with the weekly RSI (lower window)
It’s now in overbought territory (above 70)
For clarity, this is not a trading signal where you sell or go short.
The market can remain in an overbought zone for weeks or months.
For example, look at what happened through April to September 2021.
The market was overbought during this entire time (based on the weekly RSI). However, it rallied from 4220 to 4535 before correcting to the tune of around 6%
We could easily see something similar…
But I would not be surprised to see the S&P 500 trading closer to the 10-week EMA (4377) at some point over the next 4 weeks (e.g. ~4.5% lower)
Finally, in terms of how I’m trading this – I continue to maintain 65% long exposure.
I do not have any short positions and/or puts (nor have I through this entire rally).
Year-to-date my returns are 13.2% – underperforming the market due to maintaining lower exposure.
I had a solid week – with banks doing well (where I added exposure to the likes of BAC, JPM and WFC during the so-called banking crisis).
It’s too early to call that trade a win (ask me in 3 years) – but so far they are doing okay.
I also accept I will continue to underperform the S&P 500 should the market continue to rally from here.
However, I’m happy maintaining around 35% cash to buy at more attractive levels (which could happen very quickly)
I’m not willing to put new capital to risk at these valuations.
Putting it All Together
If you are wondering what to do – you should answer these two questions :
- Is it a good long-term risk / reward bet to pay 21x forward earnings for stocks with interest rates at 5.25%; and
- Is it a good strategy to buy on the assumption of double digit earnings growth – in the face of a potential recession (next year)?
For example, with respect to #1, history shows that buying the market at this multiple has not been a successful strategy.
Sure, it may rally another 5% or so, however the risks are to the downside.
With respect to the #2 – if we are to experience a recession next year (and I still think we do) – then earnings will contract (they will not expand double digits)
But your view will be different to mine…
In summary, both the forward PE is far too high (at 21x) and earnings expectations feel naive.
That said, I continue to maintain a healthy level of long exposure.
Regards
Adrian Tout
The above article is for information only. The views of the author or any people quoted are their own and do not constitute financial advice. The content is not intended to be a personal recommendation to buy, sell or hold any specific investment or to adopt a particular investment strategy. However, the knowledge that professional analysts provide can be a valuable additional filter for anyone looking to make their own investment decisions.
Ethical Offshore Investments provides guidance on portfolios that have an ESG (Environmental & Social Governance) bias and an SRI (Socially Responsible Investing) focus. By avoiding high charging, commission paying funds, this results in lower portfolio costs, so more of the growth staying in the pockets of our clients.
Ethical Offshore Investments can also assist clients in getting exposure to the investment markets such as the broad S&P 500 index through very low cost Exchange Traded Funds (ETF’s) as well as investing directly into the individual stocks.
If you would like to get more information on the Sustainable Ethical Allocation portfolios, or enquire on the vast array of Sustainable and Ethical style funds available, please click on More Information.