Trade the Tape – Will a US Debt Downgrade be a ‘Bearish’ Catalyst..?
Please find below the latest update from Adrian Tout from his regular newsletter, “Trade the Tape”.
Please note that this is for general information only and should not be considered personal financial advice.
The purpose of publishing these newsletters on the Ethical Offshore website is to provide investors some simple, easy to understand technical details on why the US markets are behaving the way they are at the moment, what has occurred to get them where they are, and what actions may influence where they end up in the near future.
The way Adrian Tout explains all this, in simple terms, I believe is good reading for any investor to get a better understanding of what is happening within the financial markets, what risks to be aware of and how to take advantage of these market conditions for your medium to longer term investment journey.

August 2, 2023 – Adrian Tout
Will a US Debt Downgrade be a ‘Bearish’ Catalyst?
-
Fitch downgrade US Debt
-
Interest payments relative to GDP sky-rocket
-
Could the market stumble if bond yields continue to rise..?
Earlier this week, Fitch Ratings downgraded the U.S.’ credit rating.
Stocks slipped a little on the news and bond yields ticked higher.
The US 10-year treasury yield is now north of 4.10%
Fitch cited “expected fiscal deterioration over the next three years” and an erosion of governance.
Hard to argue…
Fiscal restraint is not one of the government’s strengths.
But this isn’t entirely new news…
For example, the credit agency placed the nation’s rating on watch in May following a near-default after members of Congress butted heads over raising the debt ceiling.
However, this put the wheels in motion.
The debt ceiling was raised (surprise surprise) which meant the spending was set to continue.
As a result, yesterday Fitch marked the country’s rating down to AA+ from AAA.
Here’s what they said:
“In Fitch’s view, there has been a steady deterioration in standards of governance over the last 20 years, including on fiscal and debt matters, notwithstanding the June bipartisan agreement to suspend the debt limit until January 2025”
I will show what a “deterioration in standards” looks like in a moment.
But first, there were some people who were ‘less than thrilled’ by the announcement.
“Ridiculous” says JP Morgan CEO
Never one to mince words, Jamie Dimon called the credit downgrade “ridiculous”
Here’s what the CEO of the US’ largest bank (by assets) told CNBC:
“It doesn’t really matter that much because it’s the market, not rating agencies, that determines borrowing costs.
Still, it’s “ridiculous” that other countries have higher credit ratings than the U.S. when they depend on the stability created by the U.S. and its military.
To have them be triple-A and not America is kind of ridiculous. It’s still the most prosperous nation on the planet, it’s the most secure nation on the planet.
We should get rid of the debt ceiling. It’s used by both parties in ways that sow uncertainty for markets.
Dimon makes a good point… the U.S (specifically its debt) remains the ‘center’ of the financial universe.
I often say the US 10-year treasury is the most important financial asset on the planet.
Every financial instrument is tied to it.
Your mortgage, car loan, student debt, credit card debt – all tied to the US 10-year yield.
And if that goes… so too does the entire financial system.
However, just because you are the “prettiest girl at the dance” (which is what Jamie Dimon is trying to tell us) – it doesn’t mean you don’t make poor decisions.
The U.S. is the world’s reserve currency and that comes with enormous responsibility.
What’s more, it doesn’t mean you can abuse it.
And when I look at the data (vs people’s opinions) – there are reasons to raise some ‘yellow flags’.
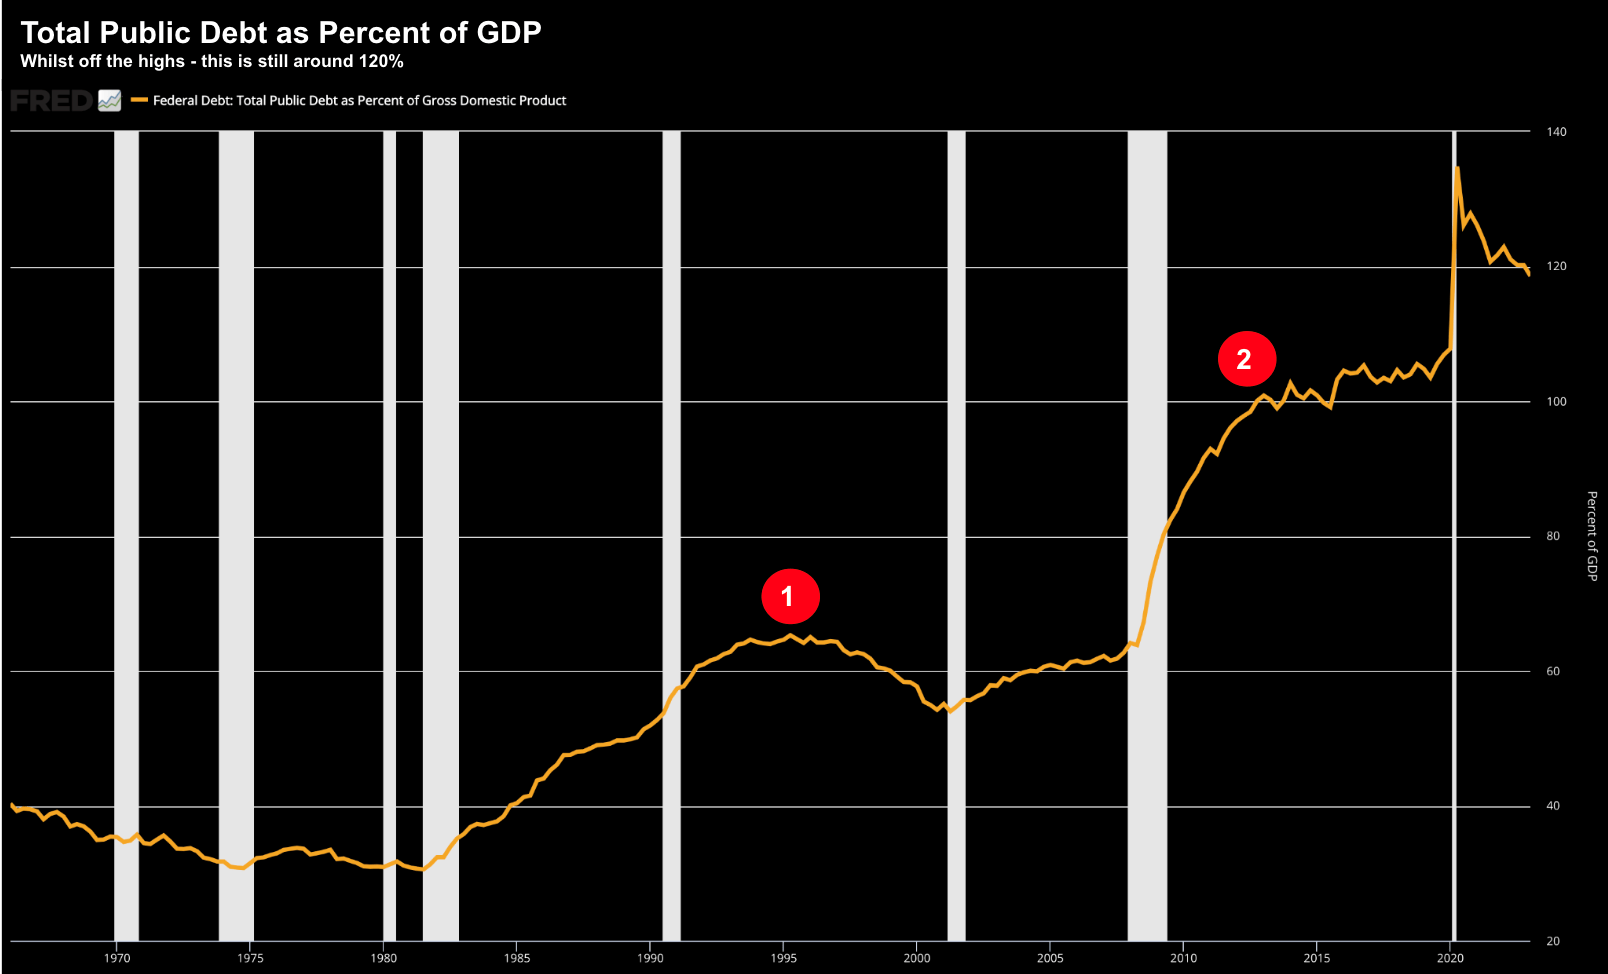
Total Public Debt to GDP
The first chart worth noting is the level of total public debt to GDP:
Aug 2 2023
This chart is slightly older than me (I was born in ’71) – going back to 1966.
For context, just after World War II, the total public debt to GDP managed to exceed 105%.
However, in the absence of any additional ‘world wars’ – the debt contracted as the economy grew faster than the debt needed.
And that’s what should happen…
As an aside, the debt is never really paid down. We just assume the economy continues to grow faster.
Now there are two key points to highlight on this chart:
- During the 1980’s we had a period of massive fiscal deficits. This saw the debt balloon to a level which many thought was simply not sustainable. Ross Perot’s Presidential campaign was based on the US not being fiscally responsible. Wiki states “Perot focused the campaign on his plans to balance the federal budget, further economic nationalism, strengthen the war on drugs” (he wasn’t successful)
- The second point of significance is the period of the Global Financial Crisis. The US economy crashed – we had the Troubled Asset Relief Program – massive public debt was issued (‘bail outs’) – and we had the S&P downgrade US debt.
Which brings us today… where we touched a level of 135% opposite the ‘COVID debt binge’ and fiscal stimulus.
However, given recent economic growth (and need to stimulate less) – the debt ratio has come back to around 119%.
Still very high – but better in relative terms.
This led Treasury Secretary Janet Yellen to say “Fitch’s timing is a little odd”:
“Fitch’s decision is puzzling in light of the economic strength we see in the United States. I strongly disagree with Fitch’s decision, and I believe it is entirely unwarranted“
“Its flawed assessment is based on outdated data and fails to reflect improvements across a range of indicators, including those related to governance, that we’ve seen over the past two and a half years.”
Yellen is clearly talking to the move down from 135% to around 119%
But there is more work to be done…
However there is another chart which may help explain why Fitch issued the downgrade.
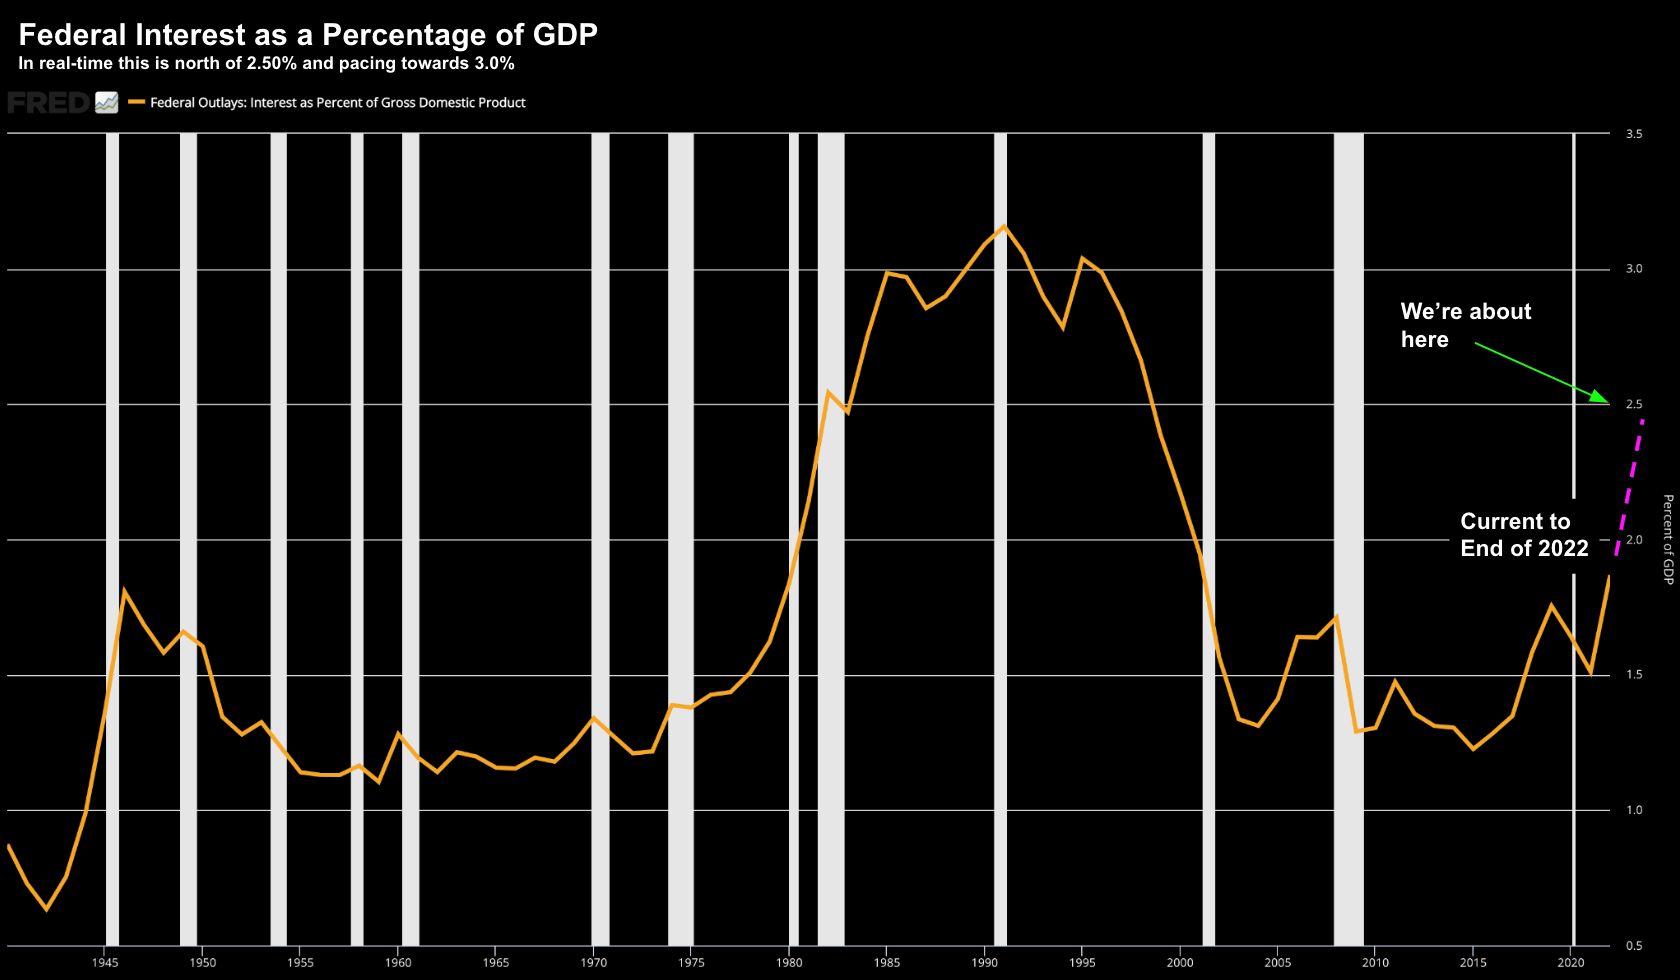
Federal Interest as a Percentage of GDP
Whilst a public debt ratio to GDP of more than 100% could be cause for concern – the growing interest bill on that debt deserves attention.
This brings me to this chart:
Aug 02 2023
This shows the interest expense of the total public debt relative to the size of the economy.
Through the 1980s – when Fed Chair Volcker was raising rates to ~18% to squash inflation – the interest expense got very high.
Not only was it above 3.0% of GDP – it was also a whopping ~10% of the total federal budget.
This chart above is only current to the end of 2022 (you can find it here)
However, as it stands at the time of writing, the current ratio of interest expense is now pushing 2.50% and many fear on track to challenge 3.0%
This is what should be ratcheting up the ‘heat’ on the current Administration to curb spending.
But this is real money flowing out (which could be spent elsewhere)
Remember:
The denominator is the size of the economy.
Therefore, if the economy continues to grow north of 2.5%, this helps.
But what doesn’t help is if the primary source of that growth is government spending (which it has been)
The growth needs to come from the productive (revenue generating) private sector.
And when (not if) we suffer a recession, this will only push the interest expense ratio higher.
As regular readers know, I think we are going to suffer a recession at some point towards the end of the first half of next year.
If the fiscal situation has not improved by then (and I don’t see why it would given the policies) – this could be a problem.
And I think this is where Fitch is coming from.
Could be wrong.
Stocks Could Stumble on Downgrade
The market lost a small bit of ground today on news of the downgrade.
However, it could be more to do with the strong upward move in bond yields we have seen the past week or so.
For example, the US 10-year is back above 4.0%
What’s more, that move isn’t done.
I say that because the US Treasury is set to issue over $1 Trillion in new bonds in the next month or so… and they will need to offer higher yields to attract investors.
This is going to put pressure on bond prices (given the torrent of new supply) — which is an opportunity for long-term holders.
But in the short-term – bond prices will likely fall.
From my perspective, I would like to see the 10-year closer to 5.0% (vs 4.0%) – but that’s not what the stock market has in mind.
Anything north of 4.0% on the 10-year will act as a headwind (particularly for growth based stocks)
What’s more, that hurts economic growth – placing more pressure on the interest expense ratio to GDP (i.e. where you need economic growth to outpace debt).
Let’s take a quick look at the S&P 500 using the weekly chart…
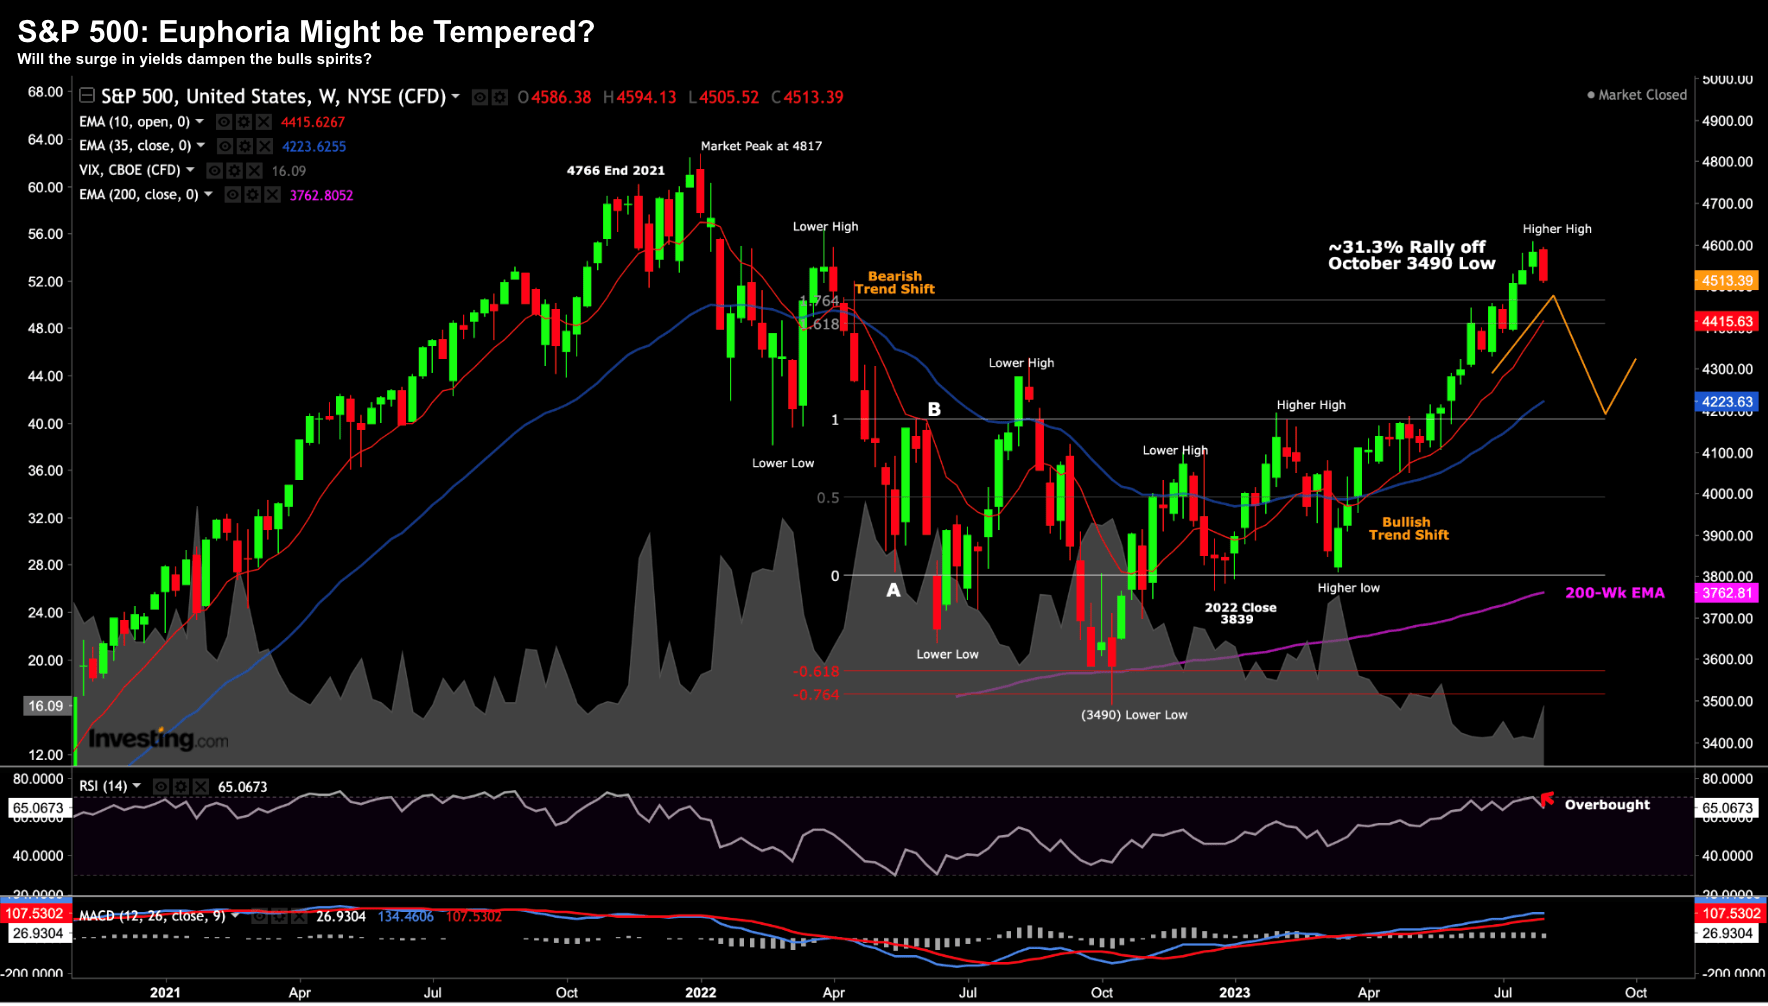
Aug 2 2023
Using this timeframe, we can see how stocks have barely reacted to the news of the credit downgrade.
Over the weekend, I said to readers to act with some caution – as we were overbought using the weekly RSI.
I also said the RSI is not a signal I use in isolation to “sell” or “go short”.
It simply means we could be about to see a pullback.
For what it’s worth, I don’t think stocks have pulled back yet.
When the Index moves higher or lower by “2-3%” – it’s par for the course.
I don’t pay zero attention to those moves (in either direction)
However, I will pay closer attention once we test the 10-week EMA (around ~4400)
At that point, we will be trading around 5% off the highs.
But I won’t be buying…
5% is not a lot given how far we have come.
But it may be enough for tactical buyers to come back in after some profit taking?
Could we see a bigger move lower?
Yes…
For example, if bond yields continue to push higher (especially on the back of $1T in new Treasury issuance), this could act as a tipping point for the bulls.
And if we see 4200 on the S&P 500 (which acted as a strong level of resistance for ~12 months) – this would be an area to add to quality positions.
To be clear, if earnings are to come in around $220 this year (which I think is still optimistic) – you’re paying ~19x forward.
That’s not a bargain… so be very selective.
Putting it All Together
Downgrades to US credit are not new.
Is this one deserved?
Well that all depends on your lens.
I can understand why the likes of Jamie Dimon and Janet Yellen were not impressed. They see the US as the best looking girl at the dance.
But do other countries see it the same way?
I’m sure they have a very different frame of reference.
Irrespective of your lens, there is no debating the US is going to be paying a lot more in terms of its interest expense.
What’s more, that money could be used for things like (not limited to) education, health or defense.
Instead it’s being ‘wasted’ on interest (due to excessive spending)
Now whilst bond yields traded near zero – no-one was paying too much attention to the interest payments.
“We can afford it” was the mantra…
Not now…
The level of debt (relative to the size of the economy) deserves scrutiny when interest costs grow 35%+ for two years straight.
The CBO project by 2030 – the US’ interest expense will exceed 3.3% of GDP (which would exceed previous levels).
Here’s another way to frame it:
Within 10 years, net interest costs will exceed federal spending on crucial programs like Medicaid and defense.
Is that a good thing?
A healthy debate is needed on the levels of borrowing and spending by government.
No government has ever spent their way to prosperity.
And if a credit downgrade (or two) is needed to have that discussion… that’s a good thing.
In the near-term – continue to keep an eye on the US 10-year yield.
It’s not finished going higher and that could pressure equities……
Regards
Adrian Tout
The above article is for information only. The views of the author or any people quoted are their own and do not constitute financial advice. The content is not intended to be a personal recommendation to buy, sell or hold any specific investment or to adopt a particular investment strategy. However, the knowledge that professional analysts provide can be a valuable additional filter for anyone looking to make their own investment decisions.
Ethical Offshore Investments provides guidance on portfolios that have an ESG (Environmental & Social Governance) bias and an SRI (Socially Responsible Investing) focus. By avoiding high charging, commission paying funds, this results in lower portfolio costs, so more of the growth staying in the pockets of our clients.
Ethical Offshore Investments can also assist clients in getting exposure to the investment markets such as the broad S&P 500 index through very low cost Exchange Traded Funds (ETF’s) as well as investing directly into the individual stocks.
If you would like to get more information on the Sustainable Ethical Allocation portfolios, or enquire on the vast array of Sustainable and Ethical style funds available, please click on More Information.