Trade the Tape – Fed can Keep Raising
Please find below the latest update from Adrian Tout from his regular newsletter, “Trade the Tape”.
Please note that this is for general information only and should not be considered personal financial advice.
The purpose of publishing these newsletters on the Ethical Offshore website is to provide investors some simple, easy to understand technical details on why the US markets are behaving the way they are at the moment, what has occurred to get them where they are, and what actions may influence where they end up in the near future.
The way Adrian Tout explains all this, in simple terms, I believe is good reading for any investor to get a better understanding of what is happening within the financial markets, what risks to be aware of and how to take advantage of these market conditions for your medium to longer term investment journey.

July 12, 2023 – Adrian Tout
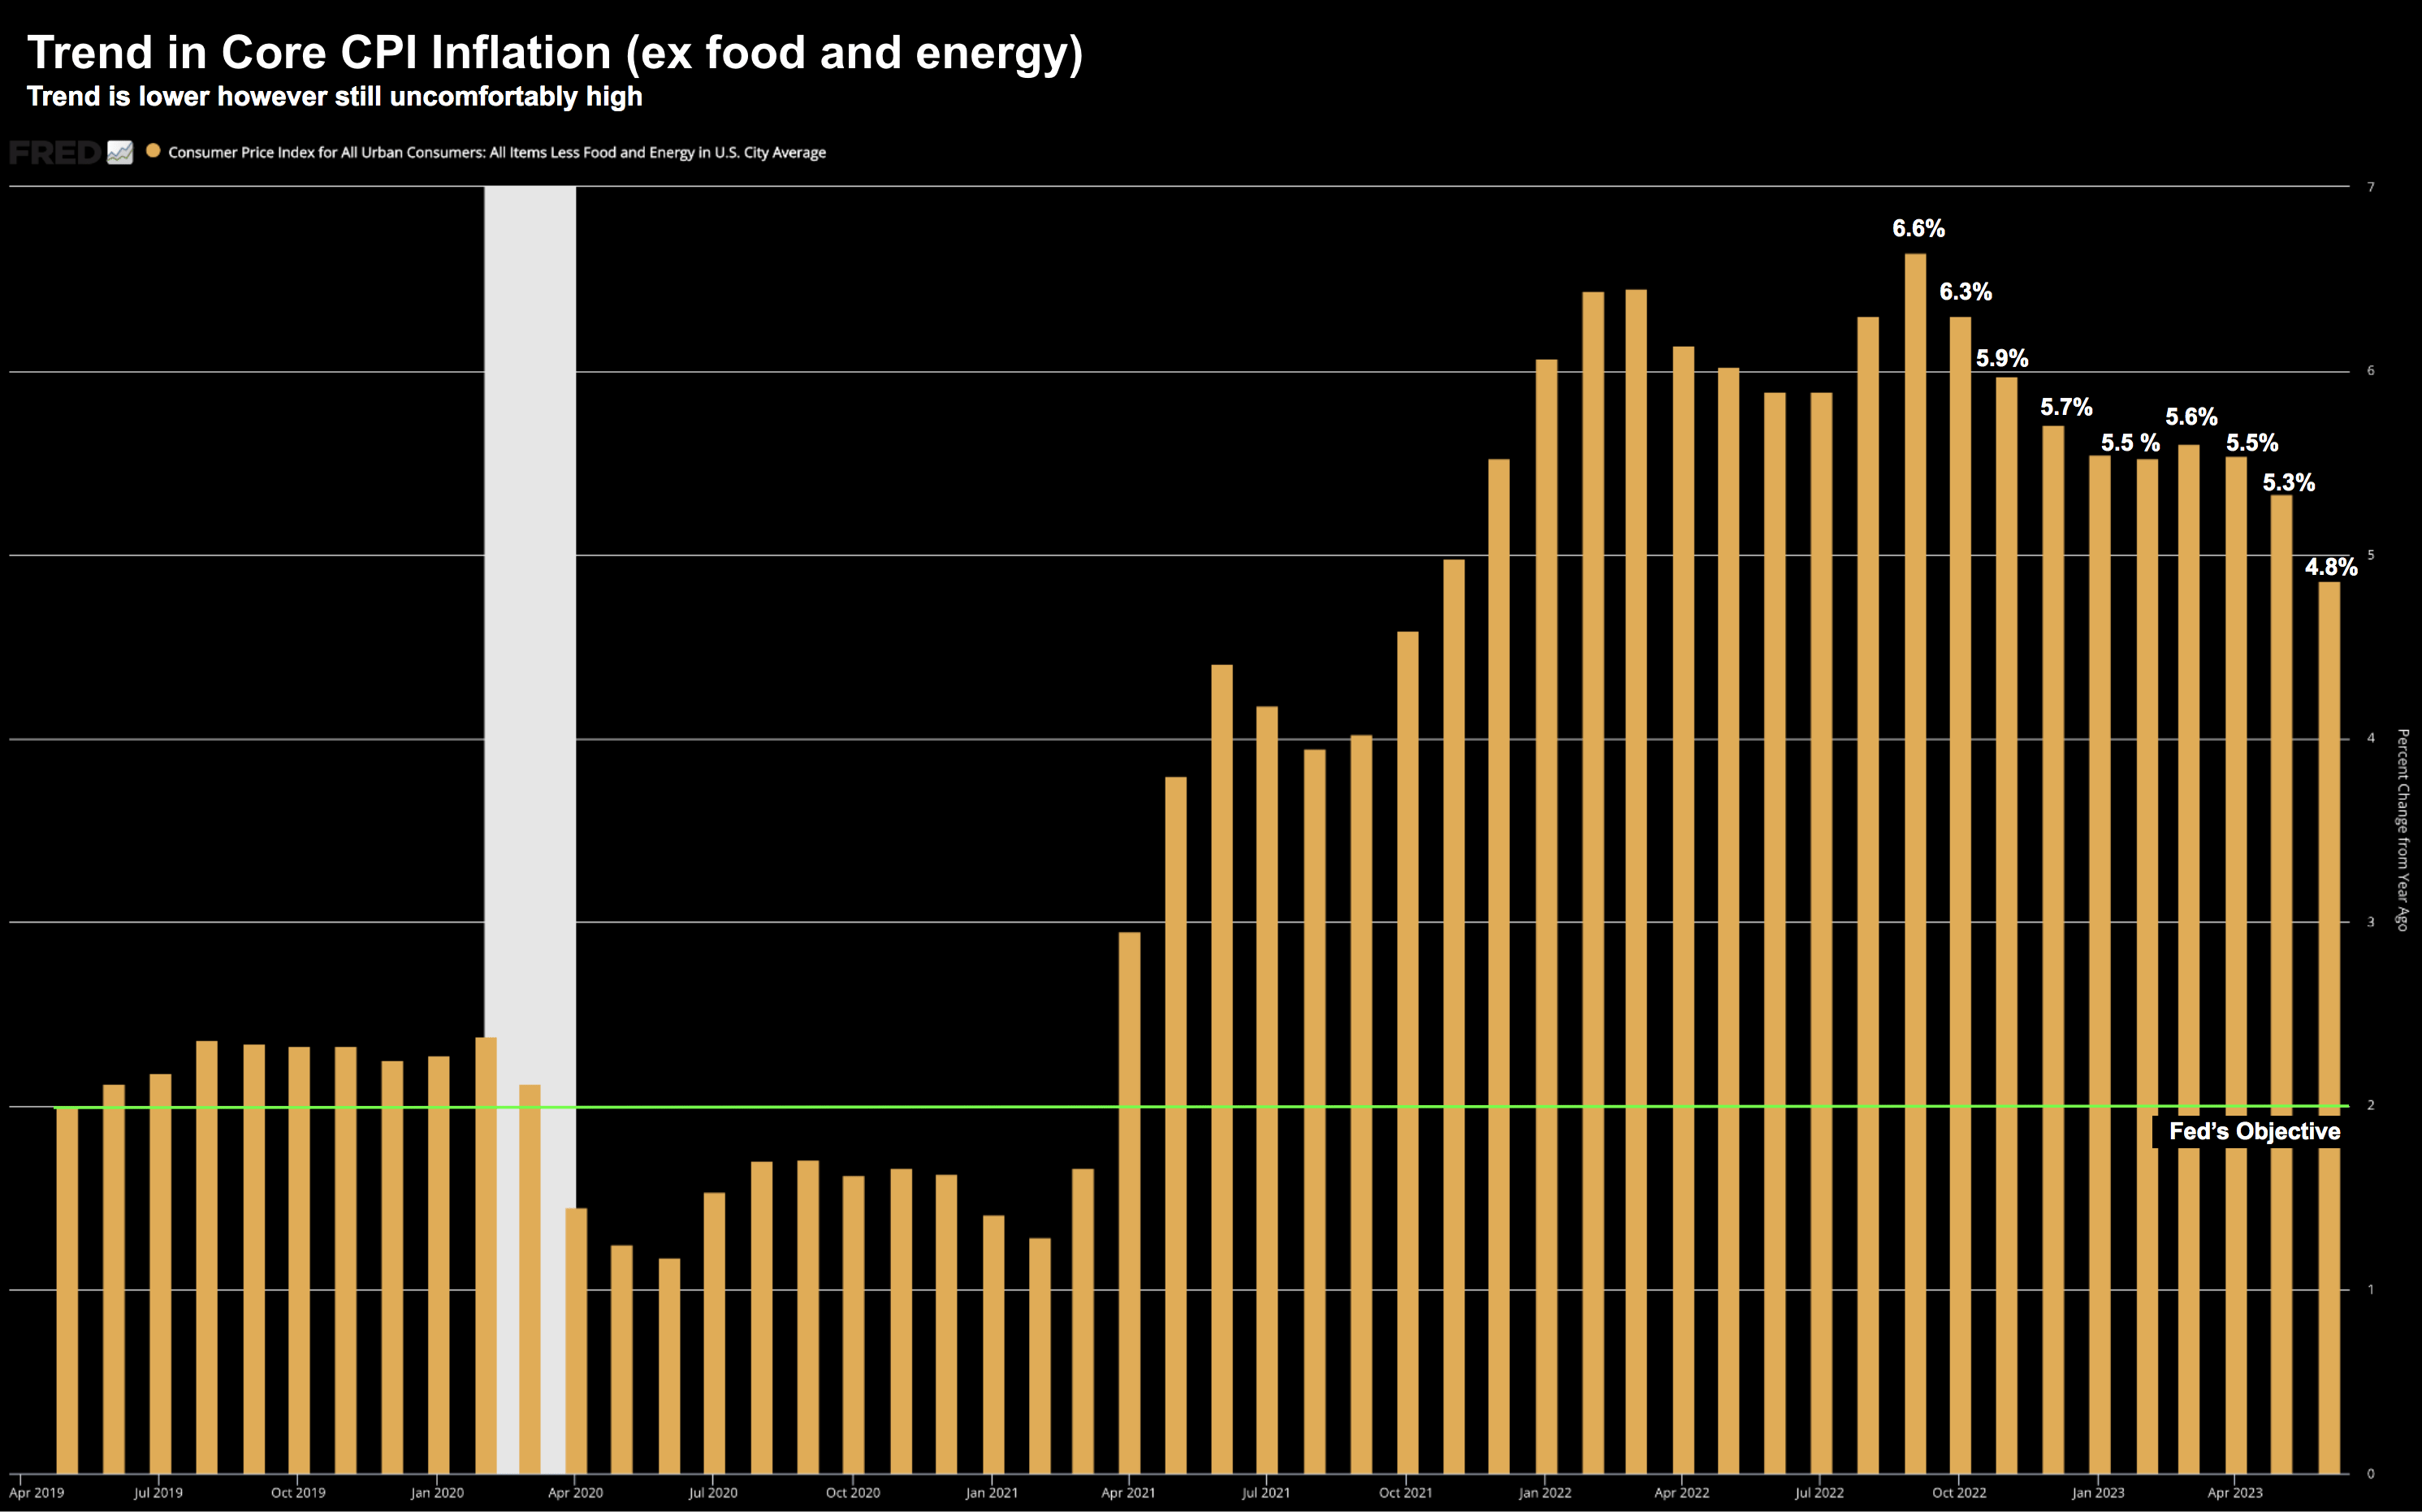
Fed Can Keep Raising w/Core CPI 4.8% YoY
-
Market celebrates headline CPI at 3.0%
-
However, Core CPI remains well above the Fed’s objective
-
Bond yields quick to fall on anticipated cuts – but I think they overshot
From the market’s perspective – today was “beer o’clock”
The inflation job is done! Tools down!!
The market cheered the news of the latest monthly CPI and Core CPI print.
Here’s a quick summary:
-
Headline CPI rose 0.2% in June and was up 3% from a year ago, the lowest level since March 2021.
-
Excluding food and energy, Core CPI increased 0.2% MoM and 4.8% YoY
-
Soft gains in food prices and declines in used vehicle and airline prices helped keep inflation down, while shelter prices continued to rise.
-
Worker wages adjusted for inflation increased 1.2% from a year ago.
In fairness, there is good news.
Headline CPI down to 3% from a year ago is a welcomed relief.
That said, it was mostly inline with expectations given the baseline effect (i.e. it’s coming off a very high inflation number last year)
But…
Core CPI at 4.8% for the past 12 months (4.6% over the past quarter) should temper some of the enthusiasm.
July 12 2023
From mine, it’s still meaningfully above the Fed’s 2% objective (green line).
Question is – how much of that was considered?
Bond Prices Rally / Yields Fall
Last Sunday I talked about how it was time to consider adding bonds to your portfolio.
I offered readers a couple of helpful ETFs for exposure.
For example, with the US 10-year, you were paid paid ~4.0% with the chance of considerable price appreciation on the basis:
(a) inflation continues to cool over the next 12+ months; and
(b) Fed could start reducing rates late next year (pending Core PCE inflation)
In other words, if rates start to fall with a lower inflation risk, it means bond prices could materially appreciate.
But for now, you are being paid 4.0% risk free at the longer-end (and near 5.0% at the front end)
That’s attractive.
Since I wrote that blog – bond yields have dropped (which means bond prices have gone slightly higher)
Following today’s CPI print – yields saw another move lower.
But here’s the thing:
I think both equities and bonds are getting a little too ‘trigger happy’.
To be fair, the market is slowly getting on board with the fact the Fed is closer to its terminal rate (e.g. perhaps another 50 basis points from here).
But the pattern I have observed is investors will often get “bulled up” on the back of one positive print.
Identifying patterns and investor psychology is critically important (more on why in my conclusion).
From there, the market is making the (bold) assumption the Fed is pretty much done.
Presumptuous?
I think so.
Core inflation is likely to only come down slowly over time. For example, it could something be closer to this:
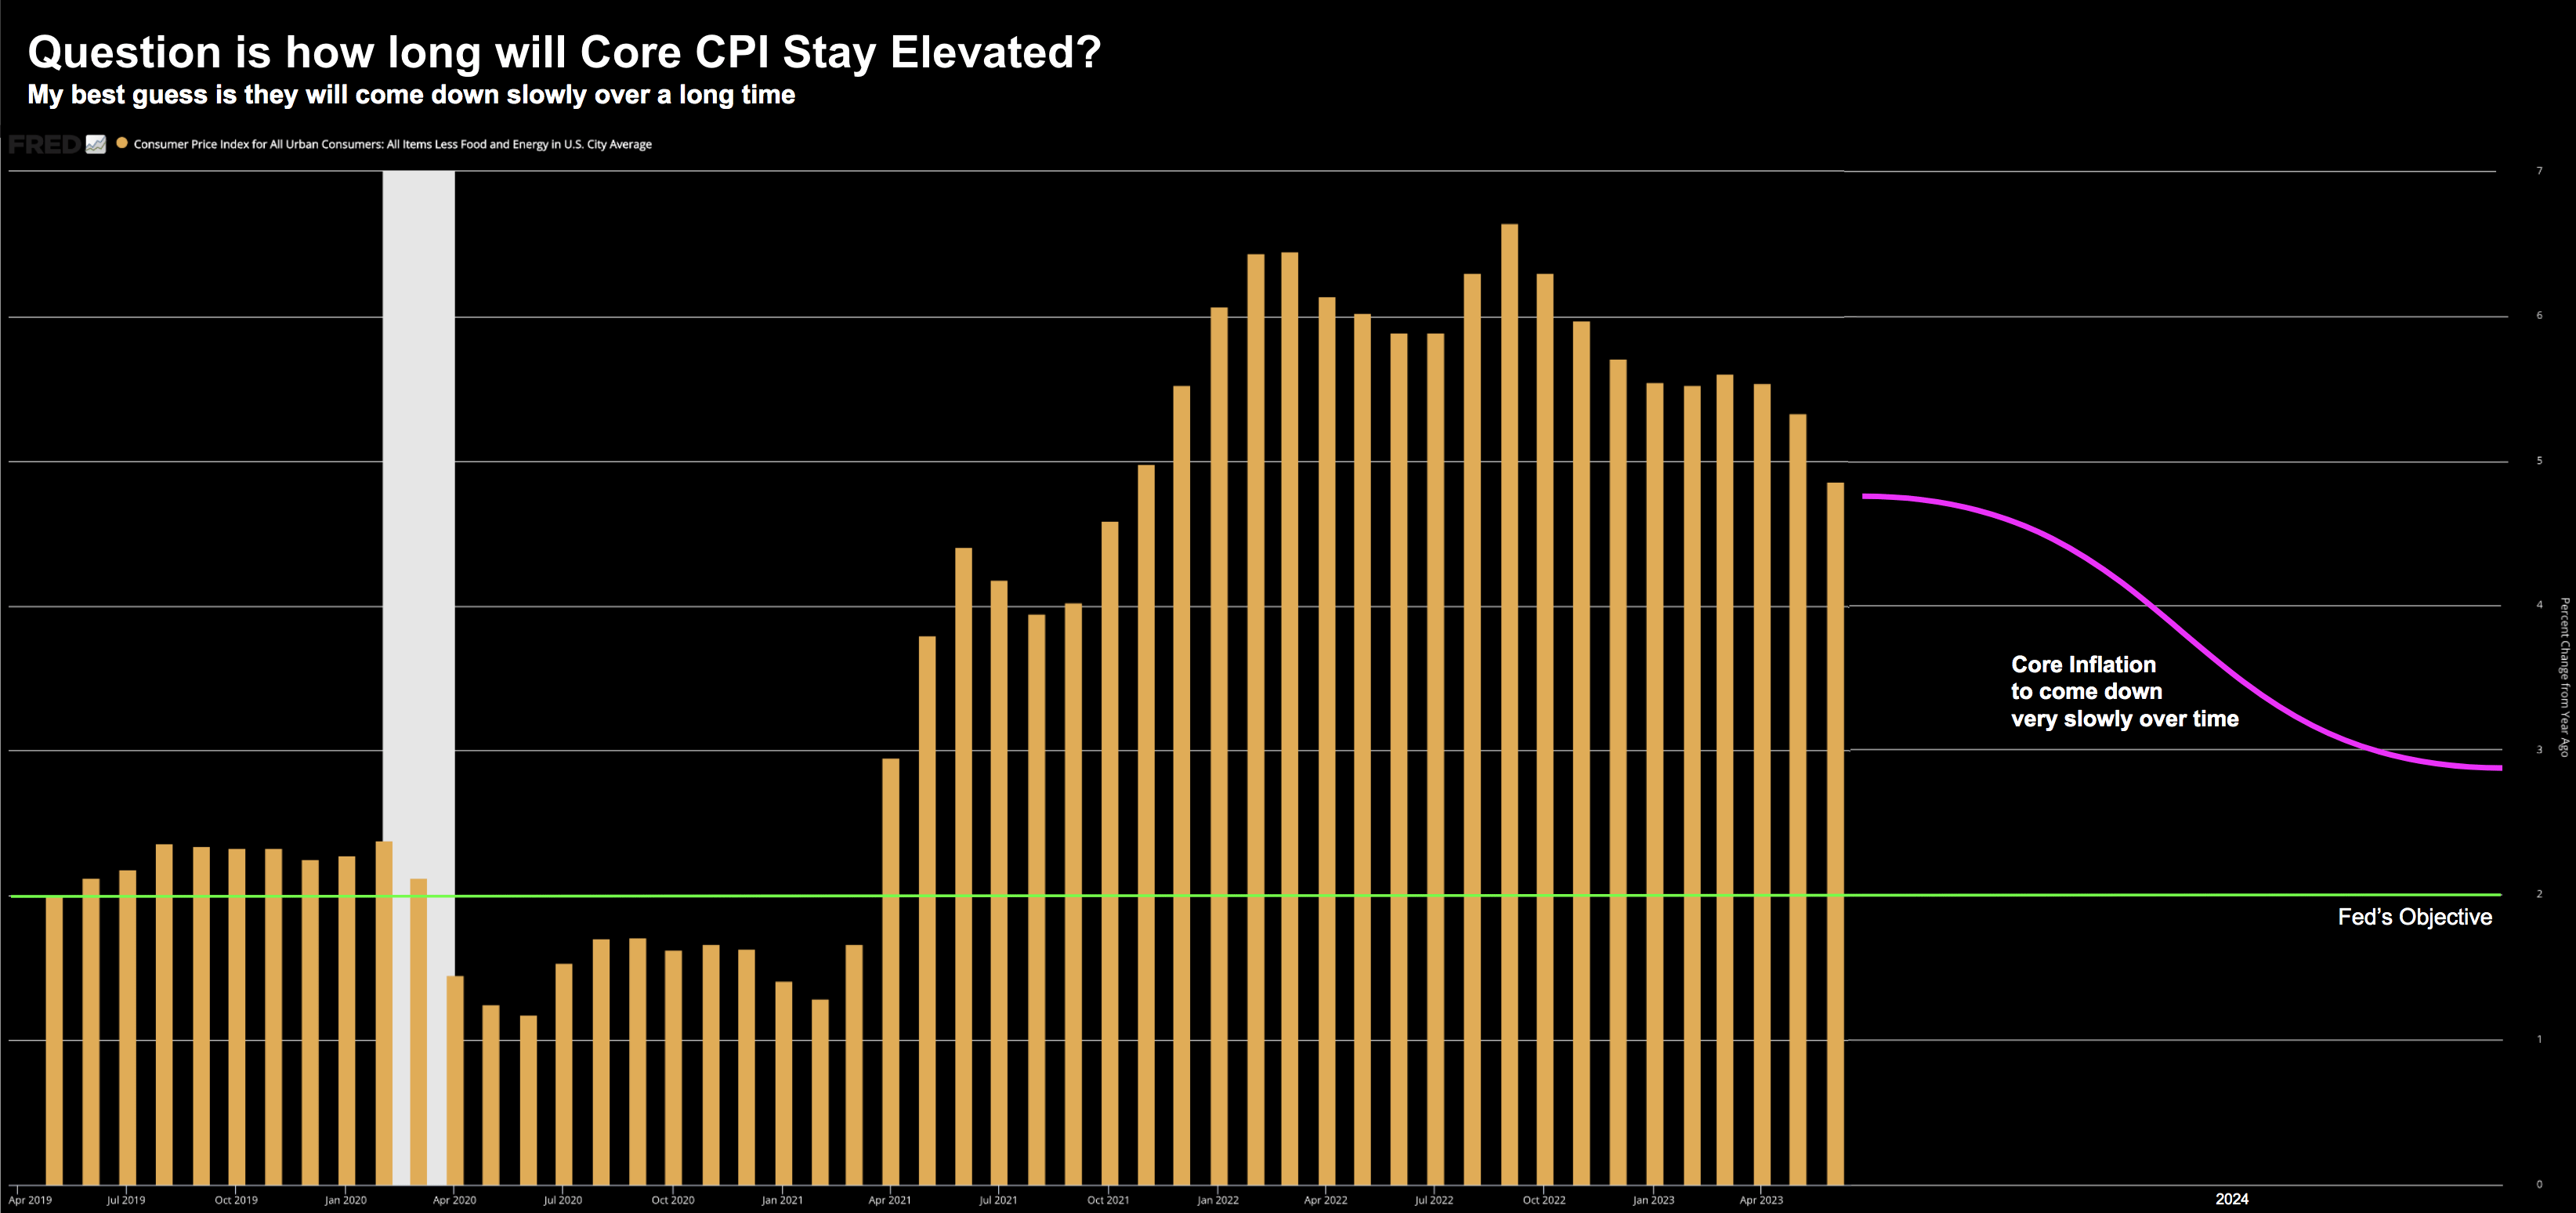
For example, it would not surprise me to see Core CPI still above 3% 12 months from now.
And if that’s true (and it may not be) – then the Fed could comfortably hold rates where they are.
Powell has said (and I’m paraphrasing here “we will get to the policy rate where we want it” (likely to be at least 25 bps higher) – and they will keep it there for a long time.
He has said this could easily be one year or two.
And for me, that’s the disconnect in the market.
Here’s what I mean:
After today, the market now believes we will see 125 basis points of rate cuts in 2024.
Last week that was 80 basis points
Question:
Do you think the Fed is thinking of cutting rates by 125 basis points next year (or more like 150 bps after they raise 25 the next meeting)?
My best guess is not if Core inflation is anything above 3%.
When Powell talks at the next Fed meeting – he is going to remind investors that Core inflation is still far too high and their work isn’t done.
And when we get Core PCE on July 28 (their preferred inflation metric) – that will probably reinforce the case.
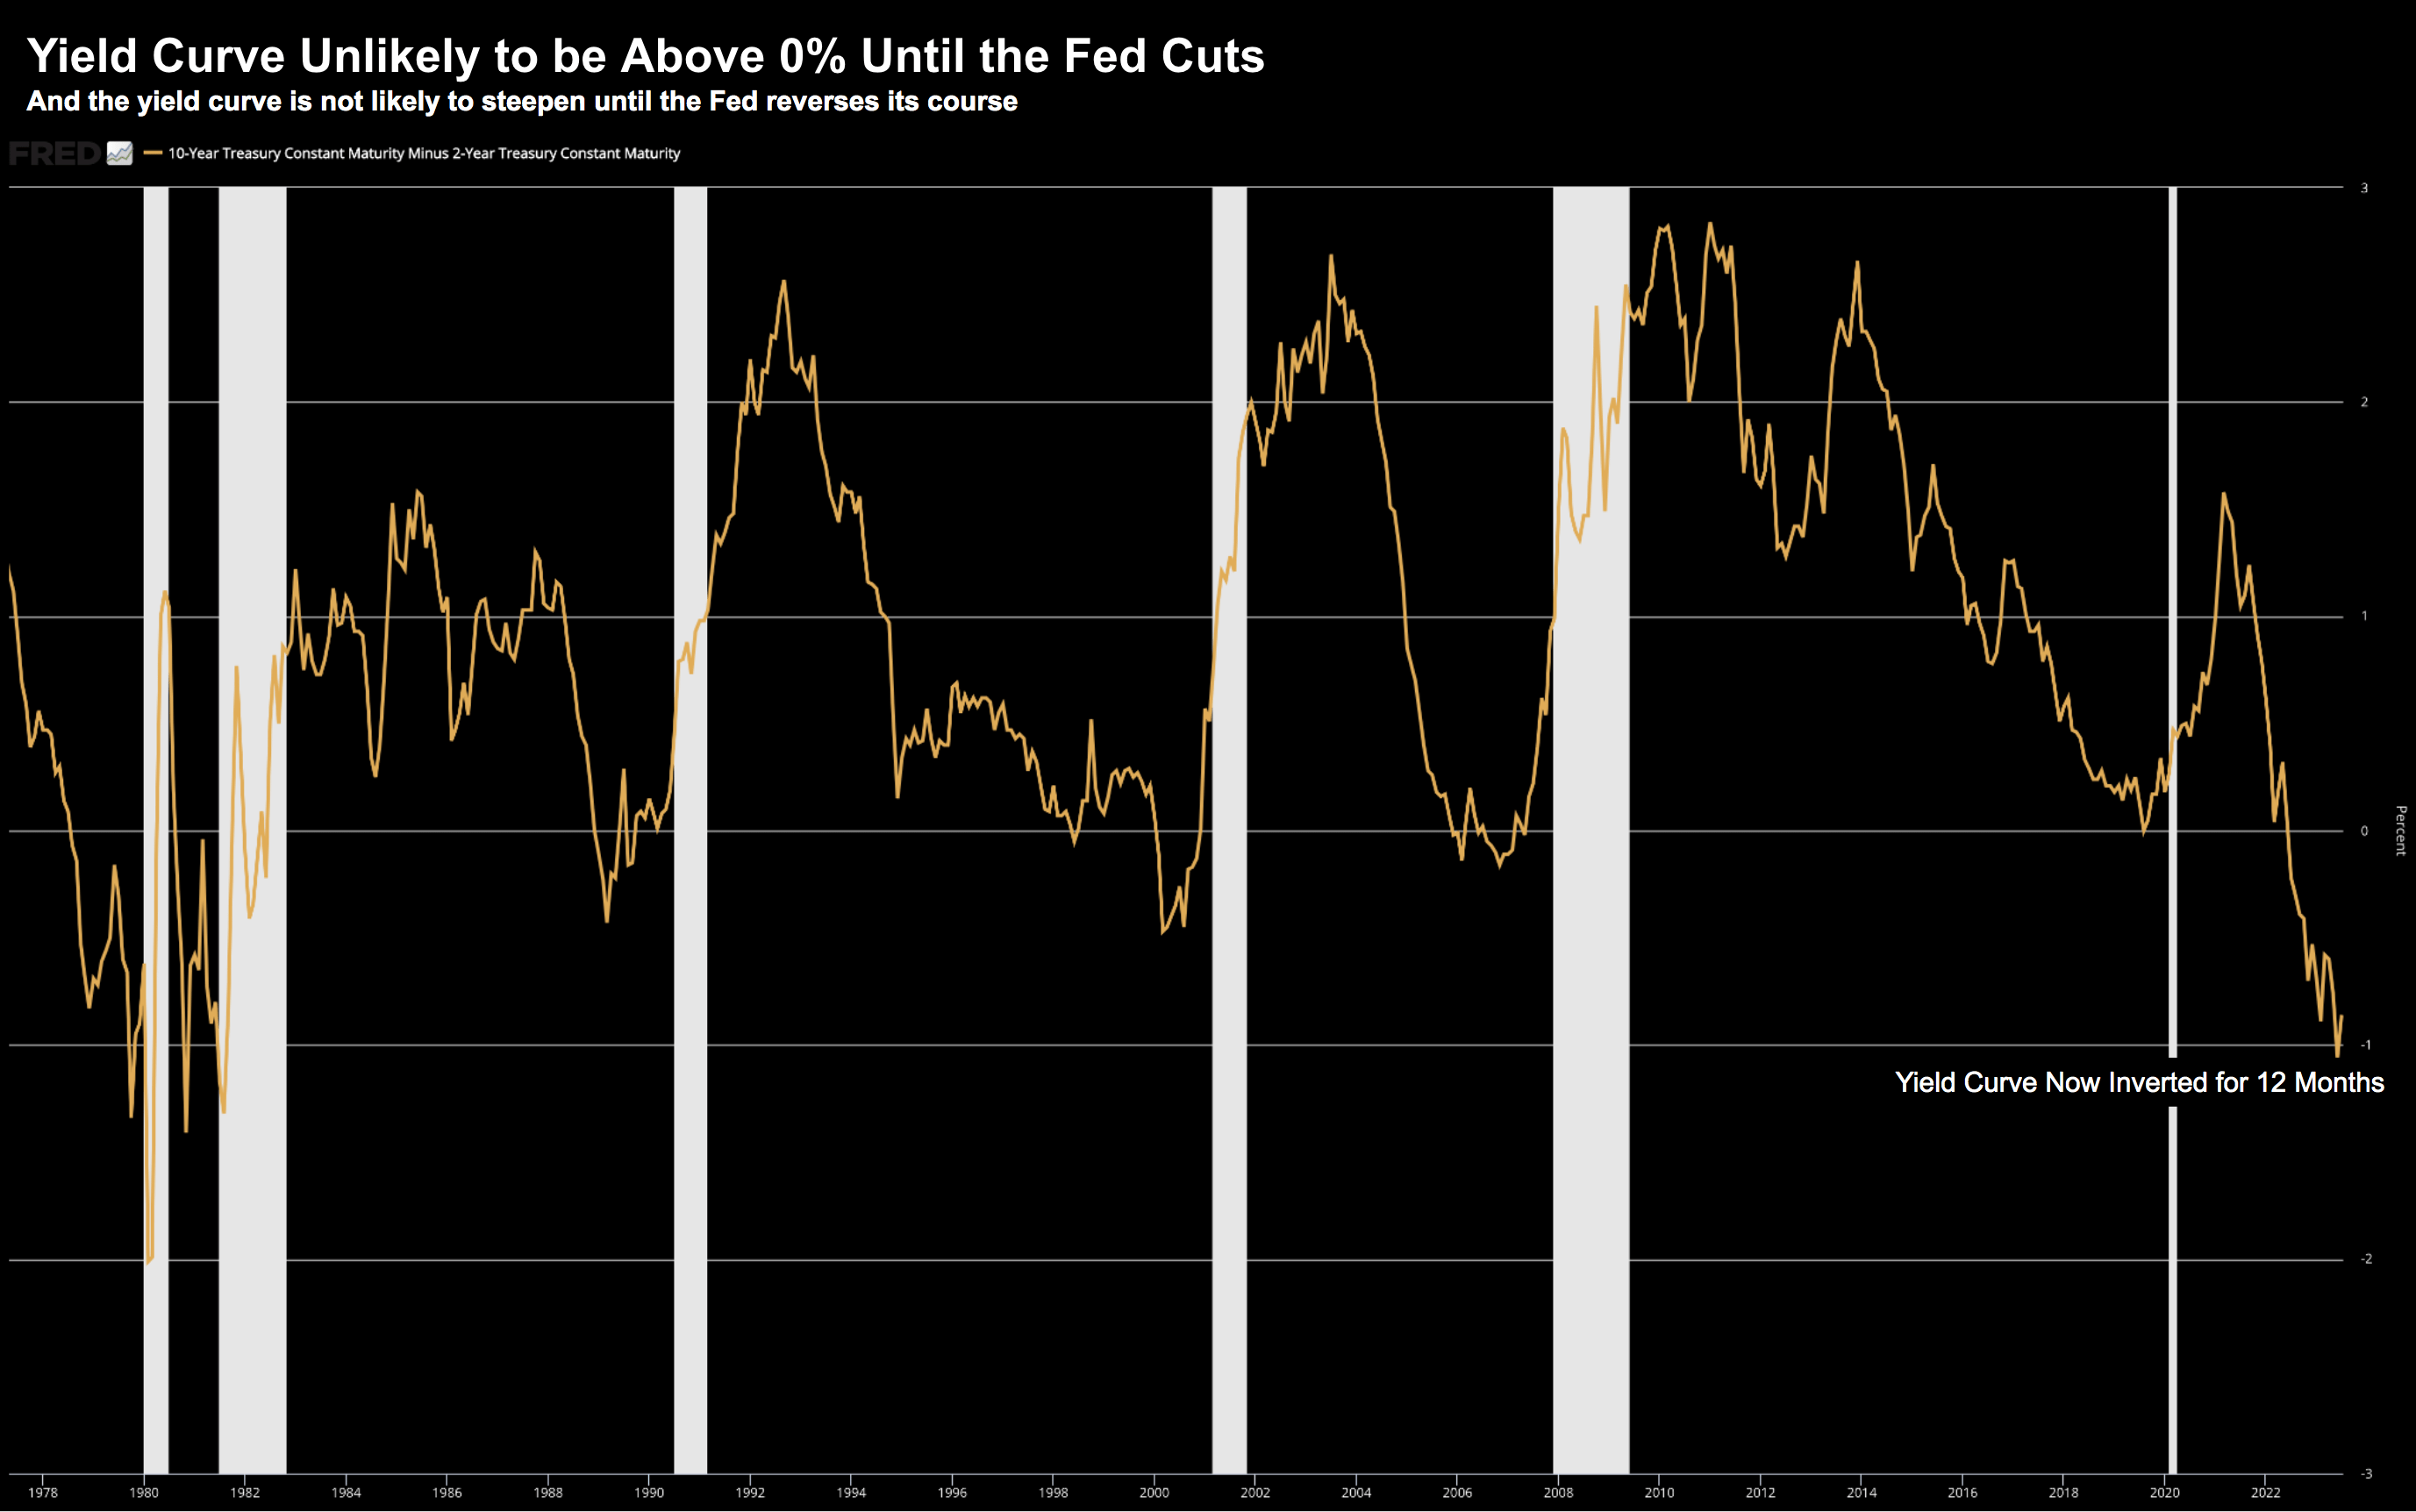
Yield Curve to Remain Deeply Inverted
The other reason to hold on “breaking out the bubbly” is what we see with the yield curve.
The longer this stays inverted (i.e., below 0%) – the more pain this is inflicting on business.
And at some point later this year – it’s likely to have a meaningful impact on the real economy (if not already).
For example, take the popular 2-year / 10-year curve:
July 12 2023
Another way of reading this chart is it’s the (bond) market saying the Fed is far too tight.
In other words, they need to lower rates at the short-end (so they are below that of the longer end).
However, as I discussed last week, the US 2-year yield was close to ~5% and the 10-year ~4% – resulting in a 100 bps inversion.
But if the Fed continues to hold rates higher (with core inflation well above its objective) – the yield curve will remain inverted.
And from mine, only when the Fed starts to cut rates will we see this curve back above 0%.
To be clear, the curve may steepen a little if the market thinks the Fed is closer to being done (like it did this week).
That’s simply the short-end getting “in front” of the Fed.
But in terms of the shorter-end trading at a lower yield than the long-end (implying it moves above 0%) – that could be at least 12+ months away.
And that hurts.
Keep Watching Bonds
As I was saying last week – keep your eye on treasuries as a great risk / reward play into next year.
With yields dropping this week – bond prices have rallied (along with stocks)
However, they may have overshot on just one data point.
That’s the typical pattern.
I think once we see the Fed raise rates again July 26th – reminding investors their work is far from done – yields will resume their upward move.
That’s the point where you can add bond ETFs like:
- AGG – iShares Core U.S. Aggregate Bond ETF (note: similar ETF is LQD)
- EDV – Vanguard Extended Duration Treasury ETF (note: similar ETF is TLT)
… as you position your portfolio to be more “recession ready” for 2024.
Putting it All Together
On an unrelated note – I encourage readers to subscribe to Howard Marks’ free newsletter.
His latest memo is titled “Taking the Temperature”
He provides a great review of the various times (in his 50+ year career) when the market was showing either irrational exuberance or extreme pessimism.
However, the ability to identify these patterns is difficult.
For Marks… it took him three decades to really understand. I quote:
You may have noticed that the first of the five calls described above was made in 2000, when I had already been working in the investment industry for more than 30 years. Does this mean there were no highs and lows to remark on in those earlier years? No, I think it means it took me that long to gain the insight and experience needed to detect the market’s excesses.
That gives you some perspective on how much time it takes to really understand markets. It’s both time and continued study.
To that end, he adds:
Hopefully we learn from our experiences as we go through life. But to really learn from them, we have to step back on occasion, look at an entire string of events, and figure out the following: (a) what happened, (b) is there a pattern that has repeated, and (c) what are the lessons to be learned from the pattern?
Could not agree more.
I think what we’re seeing with bond yields and the shape of the yield curve is a pattern that has consistently repeated.
And given the pessimism in bonds (with yields high) – and the risk of recession next year – that could represent opportunity.
But please read Marks’ latest memo – it’s packed with timeless insights and perspective.
You will be smarter for it.
Regards
Adrian Tout
The above article is for information only. The views of the author or any people quoted are their own and do not constitute financial advice. The content is not intended to be a personal recommendation to buy, sell or hold any specific investment or to adopt a particular investment strategy. However, the knowledge that professional analysts provide can be a valuable additional filter for anyone looking to make their own investment decisions.
Ethical Offshore Investments provides guidance on portfolios that have an ESG (Environmental & Social Governance) bias and an SRI (Socially Responsible Investing) focus. By avoiding high charging, commission paying funds, this results in lower portfolio costs, so more of the growth staying in the pockets of our clients.
Ethical Offshore Investments can also assist clients in getting exposure to the investment markets such as the broad S&P 500 index through very low cost Exchange Traded Funds (ETF’s) as well as investing directly into the individual stocks.
If you would like to get more information on the Sustainable Ethical Allocation portfolios, or enquire on the vast array of Sustainable and Ethical style funds available, please click on More Information.