Sustainable Ethical Portfolios – 3 year anniversary
Now that we have 3 full years of performance for the Sustainable Ethical Allocation Portfolios, it is time to compare how we have performed against other diversified, multi-asset multi-manager strategies over this period.

The start of November 2021 marked 3 years from when I constructed and starting monitoring the Sustainable Ethical Allocation Portfolios.
And while it is only 3 years, we have witnessed many significant events during this period which caused disruption to the financial markets, yet the Sustainable Ethical Allocation Portfolios and the underlying investments have continued to power on.
What are the ‘model’ Portfolios…??
As part of our Portfolio Management Service, we offer guidance on the management of 3 different risk controlled, diversified Sustainable model portfolios.
- Growth Allocation – approx. 90% allocated to global equities and infrastructure, targeting an average annualised net return of 10% – 12%pa.
- Balanced Allocation – approx. 65% allocated to global equities with the remaining allocated towards fixed interest, bonds and money market cash type assets. The objective of this portfolio is to achieve similar type returns associated with direct equity investing, while experiencing lower levels of short-term volatility, especially during negative market periods.
- Cautious Allocation – approx. 35% allocated to global equities with a higher allocation towards fixed interest, bonds and money market cash type assets. The objective of this allocation is to achieve a net return of 5%-6%pabut with lower levels of short-term volatility
The portfolios are constructed using a range of different highly rated, managed funds from various regulated Wealth Management firms. We have taken a significant bias towards managed funds that take a quality, sustainable and ethical approach to their investment process. This results in a higher allocation towards companies associated with:
- Healthcare and Biotechnology
- Education
- Technology and Cyber Security
- Renewable & Clean / Alternative Energy
Our model portfolios are currently allocated to investment funds managed by the following Fund Management groups.




![]()

Examples of some of the highly rated Managed Funds held in the Sustainable Ethical Portfolios include:
- Baillie Gifford Positive Change
- Royal London Sustainable World Trust
- Rathbones Greenbank Global Sustainability
For past regular portfolio updates, they can be accessed here.
So how have we performed over the past 3 years against benchmarks and peers..??
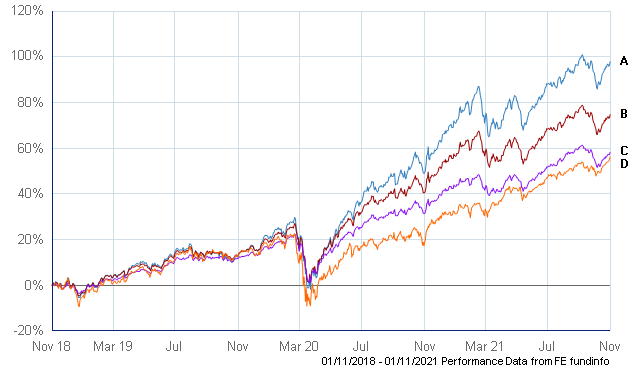
- A – Sustainable Ethical GROWTH Allocation – 26.10%pa
- B – Sustainable Ethical BALANCED Allocation – 20.76%pa
- C – Sustainable Ethical CAUTIOUS Allocation – 16.67%pa
- D – FTSE All World Index – 16.11%pa **
** as we take a global approach with our portfolio allocation, we feel that a global share index is an appropriate benchmark.
It is very pleasing to see that all 3 Sustainable Allocations have outperformed the FTSE All World Index, even more so when you consider that the Balanced and Cautious Allocations only have approx. 65% and 35% respectively allocated to the equity sector.
We have been able to provide outperformance over the period while also exhibiting lower levels of volatility. Plus, we have done so while adhering to our strict ethical business practices.
So how did we do against other Offshore discretionary management strategies..??
There are numerous wealth management firms that offer a multi-asset, multi-manager approach to offshore portfolio management. For the purpose of this exercise, I have used the more common and well-known firms in the Offshore market, being Canaccord Genuity, Tilney Group, VAM, Momentum Harmony and Marlborough, where I have used their ‘Growth Allocation Strategies to compare against the Sustainable Balanced and Sustainable Growth Allocation strategies that we have taken. (Guinness Brewin Dolphin which is also a well-known, reputable wealth management firm would have also been included but their offshore strategy has not been running for the full 3-year period).
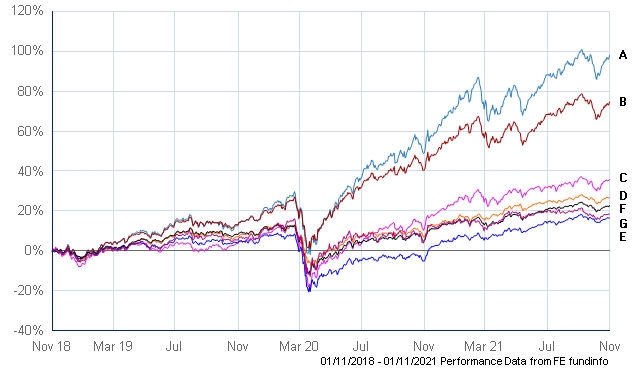
- A – Sustainable Ethical GROWTH Allocation – 26.10%pa
- B – Sustainable Ethical BALANCED Allocation – 20.76%pa
- C – CGWM Affinity – 10.60%pa
- D – Marlborough Balanced – 8.21%pa
- E – Momentum Harmony Growth – 5.25%pa
- F – Tilney Growth – 6.91%pa
- G – VAM Growth – 5.82%pa
The above performance figures are total returns (including dividends re-invested) in GB Pounds, and net of individual fund managers Annual Management Charge (AMC).
Once again, it is very pleasing to report that our strategy of a significant bias towards sustainable type entities at inception, has also resulted in our Model Portfolios outperforming similar multi-asset, multi-strategies in the offshore market.
With many of the above wealth management firms increasing their exposure to ESG and Sustainable type investments, the performance comparison for 2021 has been a lot closer.
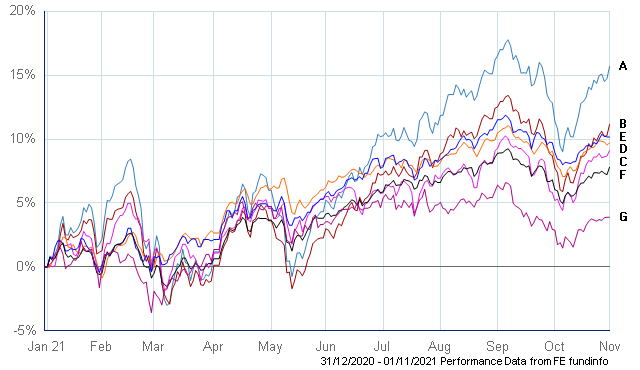
- A – Sustainable Ethical GROWTH Allocation – 15.1%
- B – Sustainable Ethical BALANCED Allocation – 10.3%
- C – CGWM Affinity – 8.8%
- D – Marlborough Balanced – 9.9%
- E – Momentum Harmony Growth – 10.1%
- F – Tilney Growth – 7.5%pa
- G – VAM Growth – 4.0%pa
I must at this point make the statement that “past performance is no guarantee of future returns”.

However, I do continue to believe that a bias towards high quality, sustainable investment strategies will result in superior returns over the medium to longer term.
And it does appear that more & more wealth management firms are coming around to this philosophy too when you start to look at the asset allocation changes being made…… but as with all investments, no matter how good the longer-term strategy is, there will be speed bumps in performance over the journey.
So why should you choose Ethical Offshore Investments..??

Over the past 3 years, we have proven that our preferred exposure to active, specialist managed funds with an ESG (Environmental, Socially & Governance) strategy has out-performed not only the benchmarks, but also that of our peers as well (once again, I must make the statement that past performance is no guarantee of future returns).
We strive to keep the ongoing charges as low as we can by utilising the lowest charging version of the funds that are available on the relevant platform. This ensure that more of the growth stays in the investor’s pockets. This has resulted in a combined total expense ratio (TER) for the underlying holdings of the Sustainable Portfolios of:
- 0.62%pa Cautious Allocation
- 0.68%pa Balanced Allocation
- 0.74%pa Growth Allocation
This is something that I am very passionate about and I do encourage clients, and prospective clients to ask the question about fees and charges. Unfortunately, there will always be charges when it comes to financial management, but clients need to know what they are paying and what services that they are getting to ensure that they are getting value for money.
Finally, it is the on-going service that our clients receive. Unlike many firms that target offshore investors, our focus is on the long-term professional relationship we have with our clients. We have regular contact with our clients to ensure that we continue to fully understand their personal financial needs and investment objectives. As the clients’ requirements change, we want to make sure that our service can be proactive in adapting to ongoing life changes experienced to ensure that their financial goals will continue to be met.
Whether it is investing via one the Sustainable Ethical Allocation portfolios or through a personalised bespoke portfolio, we will make sure that we only access regulated, and highly rated investment structures for our clients.

Sustainable Investing Strategies – Ethical Business Standards
If you would like to learn more about the portfolios or the underlying investments, please contact us using the more information button and we will respond to your queries.
If you have an existing portfolio and would like to compare the holdings against the Sustainable Ethical portfolios, once again, please click the more information button at the bottom of this screen and we will provide a clear & easy to understand, comparison report.
