Trade the Tape – S&P 500 Meets Resistance
Please find below the latest update from Adrian Tout from his regular newsletter, “Trade the Tape”.
Please note that this is for general information only and should not be considered personal financial advice.
The purpose of publishing these newsletters on the Ethical Offshore website is to provide investors some simple, easy to understand technical details on why the US markets are behaving the way they are at the moment, what has occurred to get them where they are, and what actions may influence where they end up in the near future.
The way Adrian Tout explains all this, in simple terms, I believe is good reading for any investor to get a better understanding of what is happening within the financial markets, what risks to be aware of and how to take advantage of these market conditions for your medium to longer term investment journey.

June 21, 2023 – Adrian Tout
S&P 500 Meets Resistance
- Weekly initial jobless claims the key to a ‘soft landing’
- Market trading through a key area of resistance
- Bulls need the Fed liquidity spigots to remain wide open
You can only laugh…
Apparently markets extended their ‘sell-off’ after Powell stuck to the (rate hike) script:
Here’s my question: what constitutes a sell-off?
Turns out that if stocks inch lower by less than 2%… well… that’s now a sell-off.
Reality of course is stocks have barely moved:
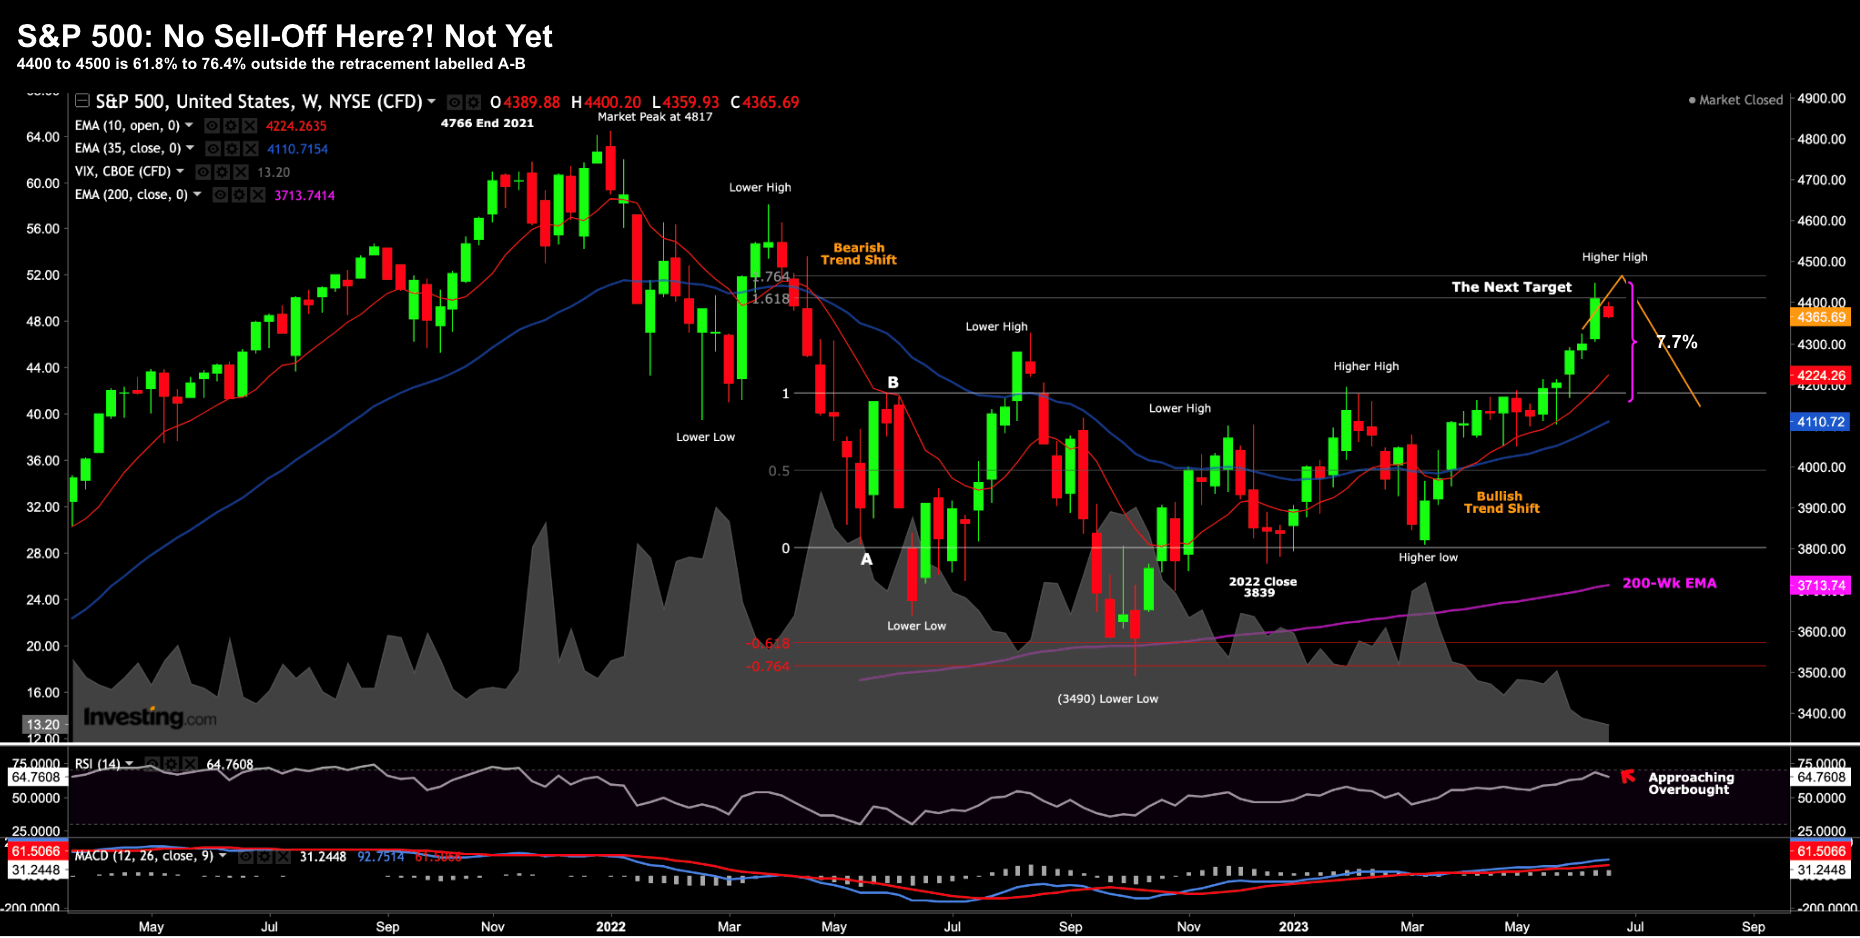
June 21 2023
As the weekly chart shows – the S&P 500 is still up ~20% from the October low; and 13.7% year-to-date.
Sell-off?
You tell me.
I might be off the mark – but I consider a sell-off as something we saw in the first part of the year – where the S&P 500 fell from around 4200 down to 3800.
Similarly, mid-last year when the Index dropped from ~4300 down to ~3600, that’s a sell-off in my book.
And there are other examples.
But less than 2%?
It’s just more mainstream noise… a headline written to get you to ‘click’.
That said, I think there is the potential for the market to give back a little more ground.
My math indicates that could be in the realm of 7-10%
But rather than call that a sell-off… my headline would be “healthy market development”
Resistance
Over the weekend I said be ready for a 7-10% correction.
I don’t know if that will play out (it probably won’t now that I’ve called for it) – but that’s what I see.
Specifically I was looking at the distance above the 35-week EMA (blue line).
Below is a closer look:
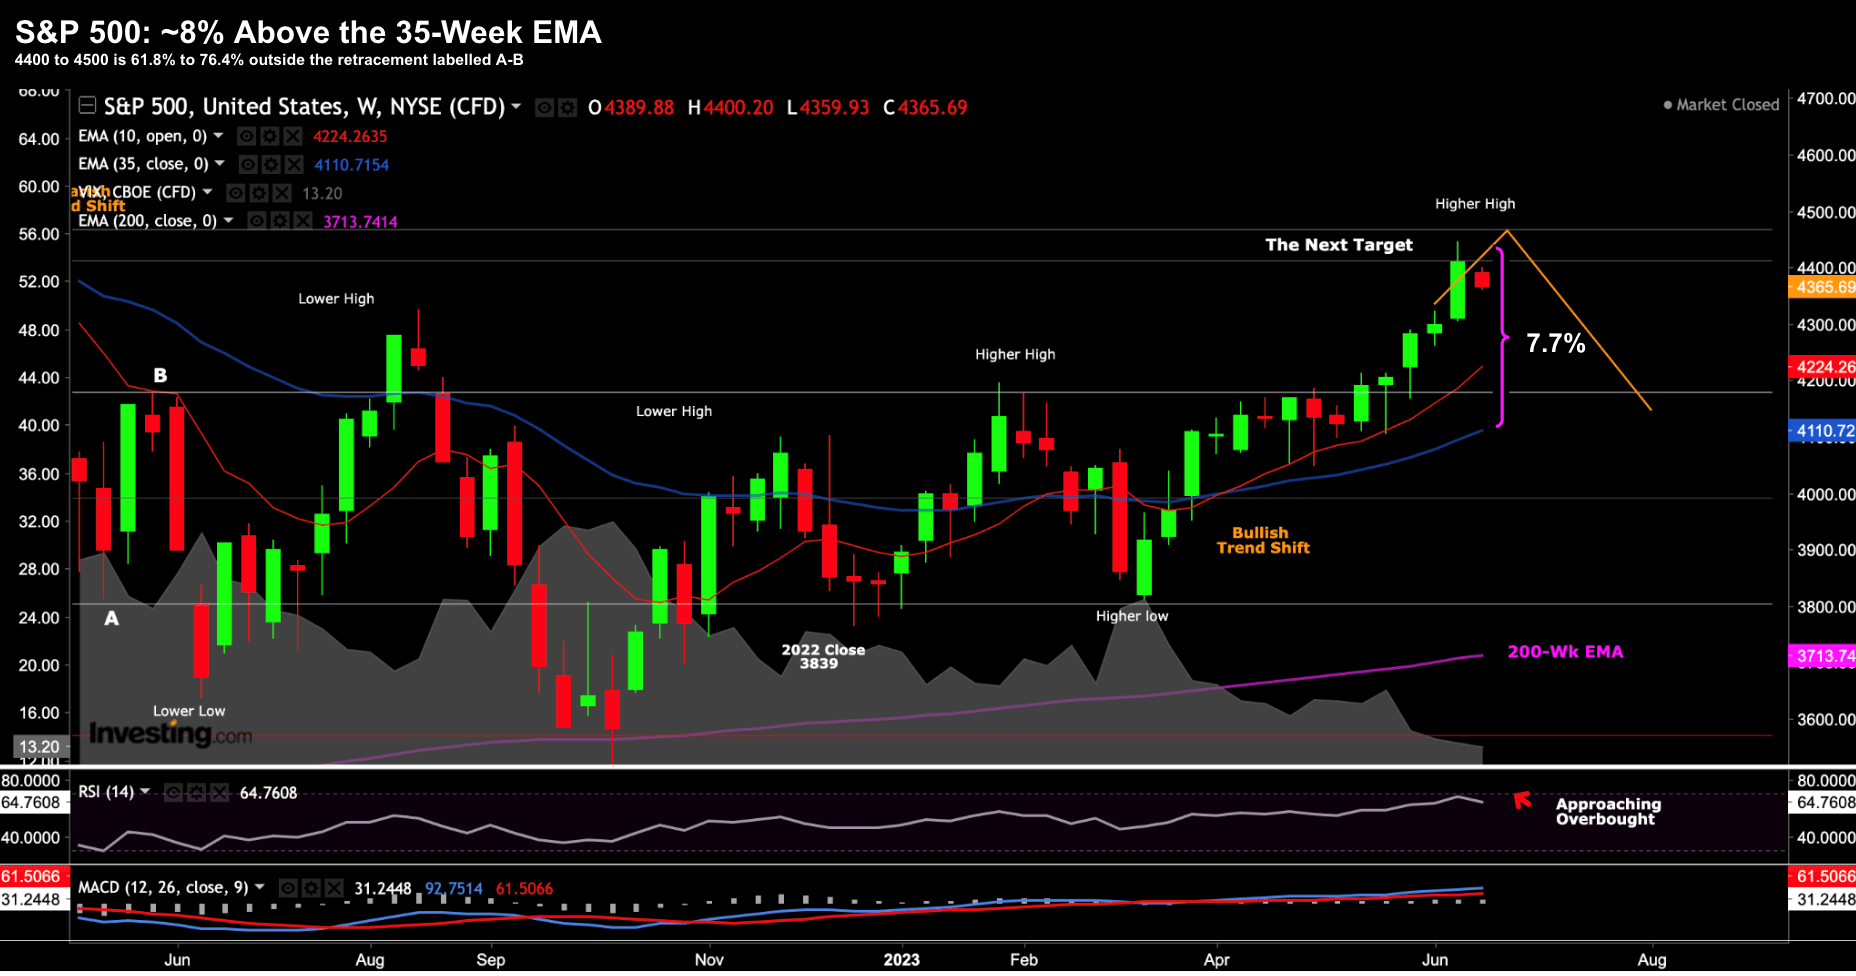
June 21 2023
Now before you ask…
I don’t have some “hard rule” that when the price extends a given amount – that it’s about to reverse.
No.
And markets can extend a lot more than 8% higher than the 35-week EMA.
What’s more, they can remain extended for several weeks.
However, when I see this order of extension (as I did in Q4 2021) – things deserve our full attention.
This is also reinforced with the weekly Relative Strength Index (RSI) (middle window)
Last week it was challenging 70 – an overbought environment.
Again, this is not a sell signal as it can go far higher and stay above 70 for weeks on end.
But it is an area to be watchful.
Now a few weeks back – I flagged the zone of 4400 to 4500 as the next target for the S&P 500.
Last week we traded as high as 4447.
This is 61.8% to 76.4% outside the distribution (“A-B”) I’ve been watching for over 12 months.
So far that call has been accurate but it’s too early to call a coupe yet.
My feeling however is the market gives back a little ground (e.g. up to 8%).
The challenge of course is we will need to hold that level once we pull back.
If we do – it’s a big win for the bulls.
However, if we don’t, then the rally of the past few weeks was nothing more than a head-fake.
It can go either way.
But I think the bulls need a few things to continue to go their way.
Liquidity
This is the market’s oxygen.
Take it away and the market will suffocate.
The good news for the bulls is they have plenty (and not just from QE)
I talked about this a few weeks ago here.
On various occasions, I’ve highlighted the striking correlation between the Fed’s purchasing of bonds (QE) and the performance of the S&P 500
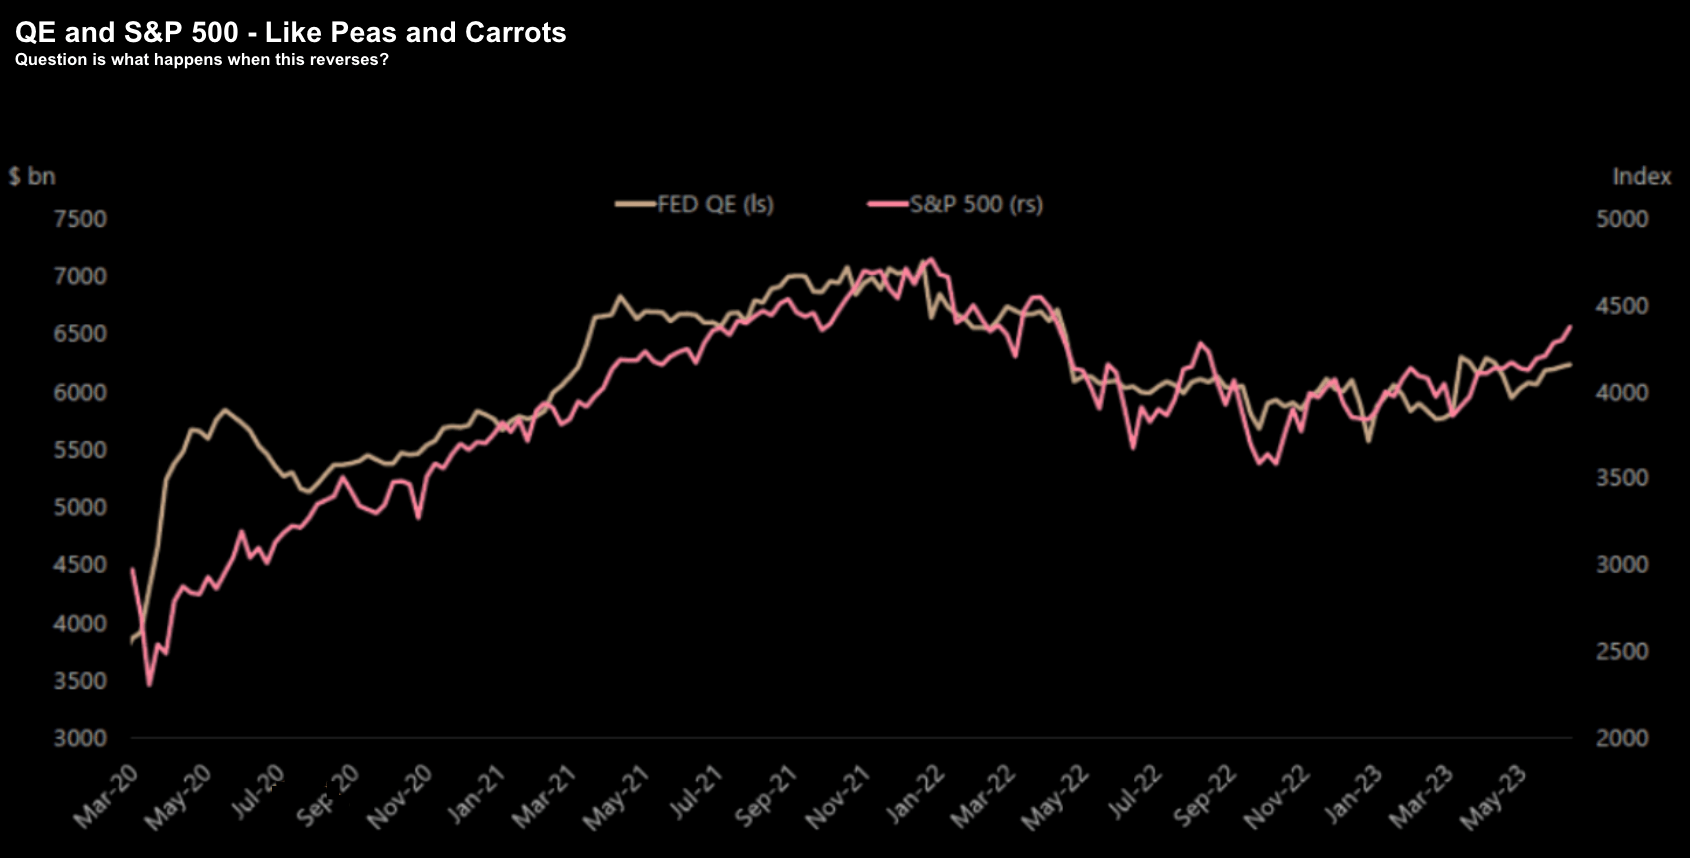
We saw something very similar post the global financial crisis of 2008.
Billionaire Hedge Fund manager – David Tepper – famously called it at the time – when the Fed first announced QE.
It’s since been dubbed the “Tepper Rally”
But what’s perhaps confusing some bears is despite the obvious slowdown in the economy – when the Fed turned on their liquidity spigots – stocks rally.
The market and the economy are not the same thing.
Now if you jump up and say “hang on Adrian… aren’t the Fed reversing QE”?
Yes they are…
But as I explained in here and here – the Fed can inject liquidity outside of just bond purchases.
For example, the liquidity provided by making it easier for banks to borrow has made its way into risk assets.
And from mine, this was the single most important 2023 pivot point for the market.
Bears were saying “this is a repeat of 2008…. banks are going bust…. time to sell and/or short the market”
Trust me, I had readers telling me it was the GFC all over again.
However, the bulls were saying “here come the liquidity spigots and up we go”
As for me, I was stepping up and buying banks at around 1x book value.
I will let you know if 2-3 years if the trade works out.
The “crisis of confidence” (which now seems to be idiosyncratic and not systemic) provided more impetus for the Fed to keep the spigots open.
For example, in fear of more banks potentially failing, they went to extraordinary lengths to make sure institutions had enough access to cash.
They didn’t want any accidents.
And whilst we can argue whether this has worked counter to bringing down inflation – the effect on risk assets is clear.
Putting that all together – if the liquidity is there – that bodes well for the bulls.
And right now – it is.
However, should we see signs of liquidity drying up… then we cue the exits.
A ‘Soft Landing’
The other premise the bulls are leaning into is the prospect of a so-called soft-landing.
Every second day you will hear some talking head saying “we expect a soft landing”.
It’s now consensus from Wall St.
For clarity, this language implies immaculate disinflation down to ~2% without unemployment exceeding 4.5%
Now whilst I buy the liquidity argument…. a soft-landing is a harder theory to swallow.
And here I come back to the indicators I talked to here.
For example, the inverted yield curve suggests a soft-landing is most unlikely.
Possible? Yes. Probable? No.
Let me explain:
When interest rates over short periods are higher than over longer periods, it implies the market expects rate cuts soon.
In other words, the curve itself implies a recession will force the central bank’s hand.
But what did Powell tell us today?
From the Financial Times:
Jay Powell reiterated his defence of the Federal Reserve’s recent decision to forgo an interest rate rise at a high-stakes congressional hearing on Wednesday, but signalled further tightening as he said the battle against inflation was not over.Powell, chair of the US central bank, told members of the House financial services committee that skipping a rate rise last week was “prudent” given “how far and how fast” the Fed had lifted its benchmark rate since March 2022.
We are now approaching 11 months of inversion.
By way of comparison – it was inverted for 18 months going into 2008
Sure, the curve steepened slightly after the idiosyncratic bank failures. At the time, the market was certain rates were about to be cut.
Wrong.
Now we know that is not going to be a systemic problem (as the bears were betting on) – we are back down to almost 100 basis points inverted.
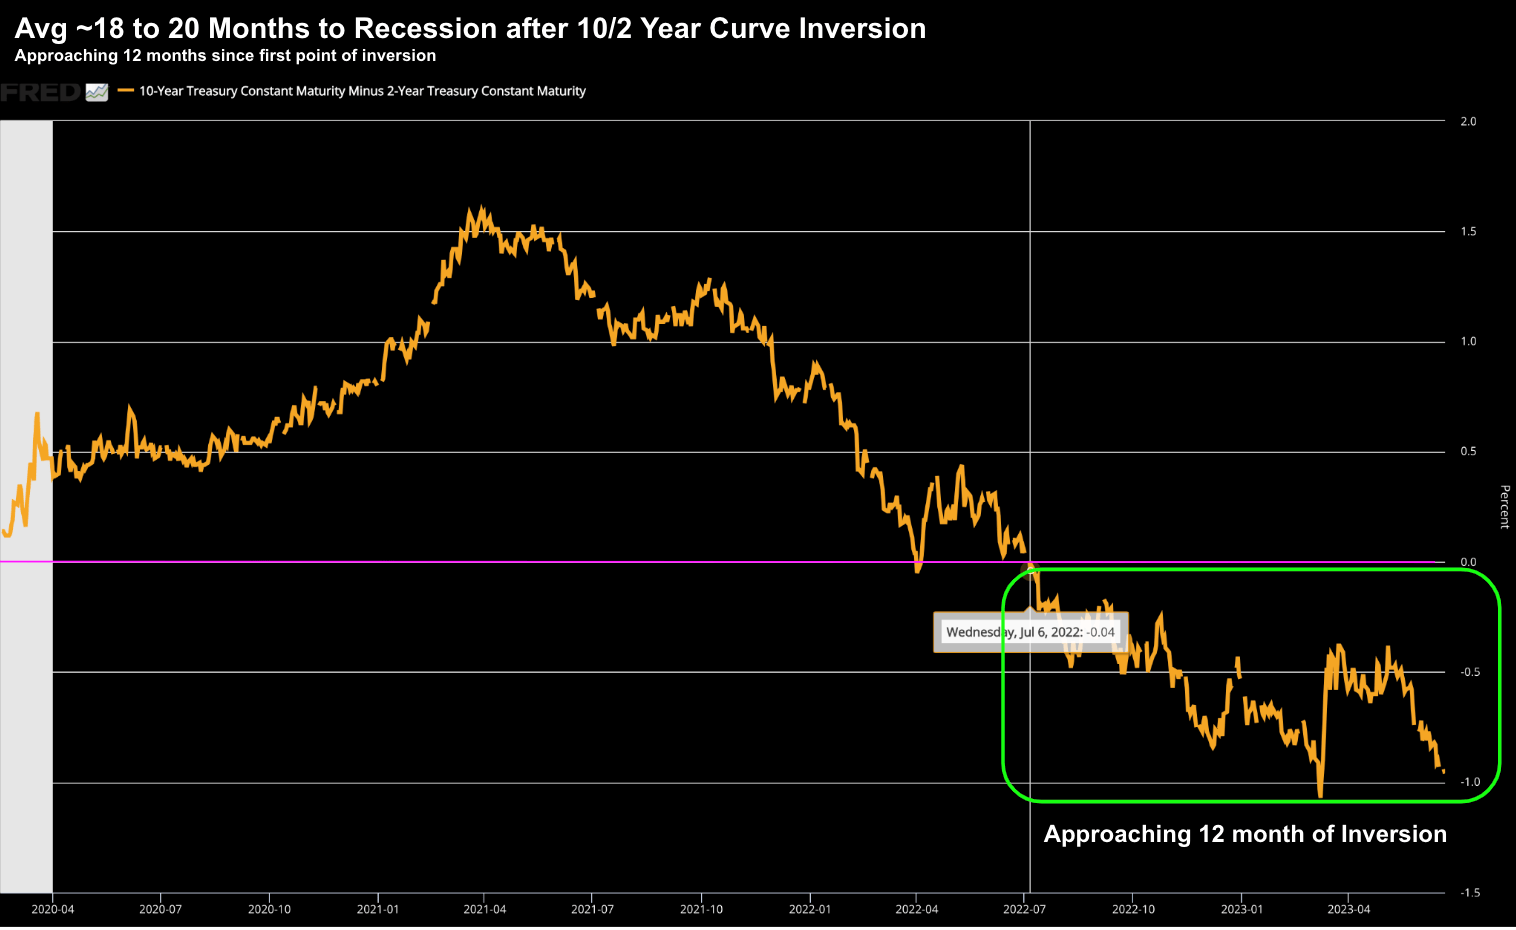
June 21 2023
As I explained here – it can take between 12 and 24 months after the initial point of inversion for the recession to take hold.
The bulls are saying history is unlikely to repeat.
But from mine, that is a lower probability outcome.
Putting it All Together
In closing, there are a few arguments not to be overly bearish.
For example:
- Q1 earnings were better than feared;
- Bank deposits have stabilized;
- Inflation is slowly (but surely) working its way down (there’s more work to do);
- The Fed is closer to its terminal rate (vs where they began); and
- We’re yet to see any major deterioration in credit
The last point is critical.
Neither businesses (or consumers) are collapsing under the weight of the Fed’s tightening.
For now, things appear to be relatively robust.
The most direct way for tighter monetary policy to slow the economy is through stemming the flow of bank loans.
And whilst we have seen some of this – so far credit conditions are good.
To be clear, credit growth has stalled (which is not a bad thing) – however we are not seeing any credit squeeze.
Not yet at least.
Before I close, tomorrow we get initial weekly unemployment claims.
The last two weekly initial claims came in around 260,000.
If we see this start to inch above 300,000 (and hold around that level)… it’s a sign the job market is weakening.
That’s the risk to any so-called ‘soft landing’ script.
Regards
Adrian Tout
The above article is for information only. The views of the author or any people quoted are their own and do not constitute financial advice. The content is not intended to be a personal recommendation to buy, sell or hold any specific investment or to adopt a particular investment strategy. However, the knowledge that professional analysts provide can be a valuable additional filter for anyone looking to make their own investment decisions.
Ethical Offshore Investments provides guidance on portfolios that have an ESG (Environmental & Social Governance) bias and an SRI (Socially Responsible Investing) focus. By avoiding high charging, commission paying funds, this results in lower portfolio costs, so more of the growth staying in the pockets of our clients.
Ethical Offshore Investments can also assist clients in getting exposure to the investment markets such as the broad S&P 500 index through very low cost Exchange Traded Funds (ETF’s) as well as investing directly into the individual stocks.
If you would like to get more information on the Sustainable Ethical Allocation portfolios, or enquire on the vast array of Sustainable and Ethical style funds available, please click on More Information.